Last updated October 6, 2026
Our research team aggregated data from 21 unique sources to estimate ChatGPT’s usage as of October 2026. Because each source used a different methodology for calculating usage, our model used a weighted average across all sources, with weights based on each source’s longevity, credibility, and reputation for accuracy. We also applied the model to the trailing 12 months to capture ChatGPT’s usage trends over the last year.
ChatGPT User Volume
The table below shows unique individuals active in a given month. We’ve included standalone ChatGPT (website + app), Microsoft Copilot (powered by OpenAI models), and their combined numbers.
| ChatGPT**excluding Copilot | Microsoft Copilot *Powered by OpenAI | ChatGPT Combined Total | |
| Monthly Active Users | 804 million | 110 million | 914 million |
| Visits | ~5.8 to 6.0 billion | ~97 million | ~5.9 to 6.1 billion |
| AI Search Market Share | 52.1% | 1.3% | 53.4% |
| Estimated Quarterly User Growth |  |  | |
| 12 Month User Trend |  |  |  |
Growth Paths for ChatGPT and Copilot
ChatGPT’s growth is driven by OpenAI’s broader distribution, which continues to lift its user base even as the pace of growth moderates. User growth has slowed to mid-single digits as the market becomes saturated in developed countries and competitors such as Gemini and Claude grow faster. We still expect ChatGPT usage to grow from future developments, including:
- Enterprise adoption
- The GPT-6 rollout
- Deeper workflow integration
Copilot’s standalone usage is growing more slowly for structural reasons. Microsoft has embedded it into Word, Excel, Outlook, and Teams, so the underlying OpenAI models are reached through those apps more often than through the standalone assistant. Even so, Copilot’s market share has climbed from a March low of 1.11% to 1.32% in September, its highest reading of the year, and its user base grew an estimated 3% in the third quarter.
Growing User Base, Shrinking Market Share
ChatGPT User Base vs Market Share: 12 Month Trend
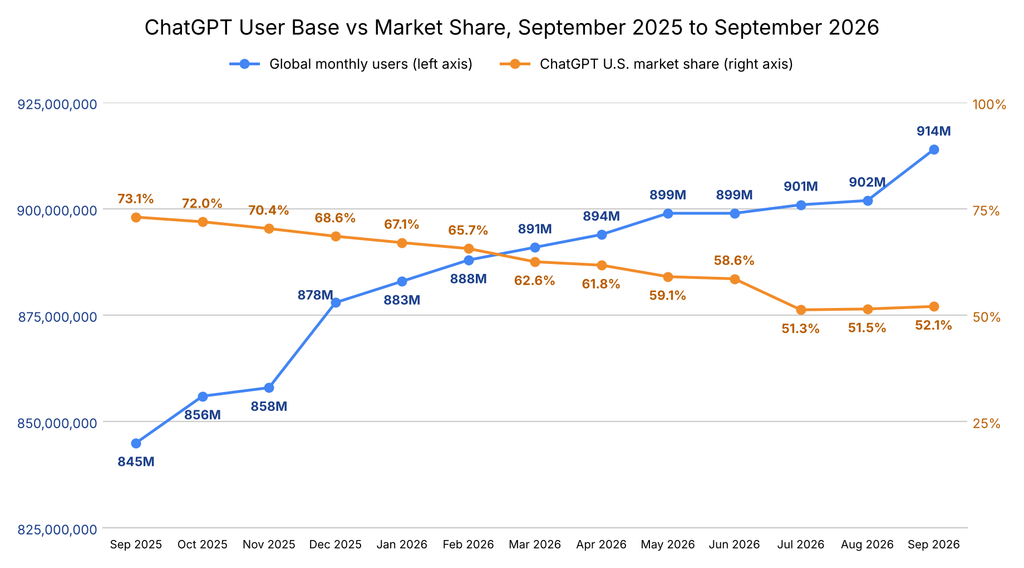
ChatGPT’s monthly users rose from 845 million to 914 million over the past year, a ~8% increase. However, ChatGPT’s AI search market share fell from 67.1% in January to 52.1% in September, and the combined ChatGPT and Copilot share stands at 53.4%. The overall market is growing faster than ChatGPT, which lets it gain users even as it loses share to faster-growing competitors such as Gemini and Claude.
The largest user increase came in late 2025; growth in 2026 has been much slower, with only 3 million users added over the summer as the platform approaches saturation in developed markets. September broke from that pattern. Following the GPT-6 launch, ChatGPT added 12 million users, its largest monthly gain since December 2025, and recovered 0.6 points of market share.
AI Chatbot U.S. Market Share: October 2026
Our model tracks seven chatbots by share of U.S. monthly active users. Over the past 12 months, ChatGPT’s share fell 21.0 points, from 73.1% to 52.1%, while Google Gemini and Claude gained a combined 22.1 points. ChatGPT’s steepest decline came in July, when it lost 7.3 points and Gemini gained 6.5. The chart below shows each chatbot’s share from September 2025 through September 2026.
AI Chatbot U.S. Market Share: 12 Month Trend
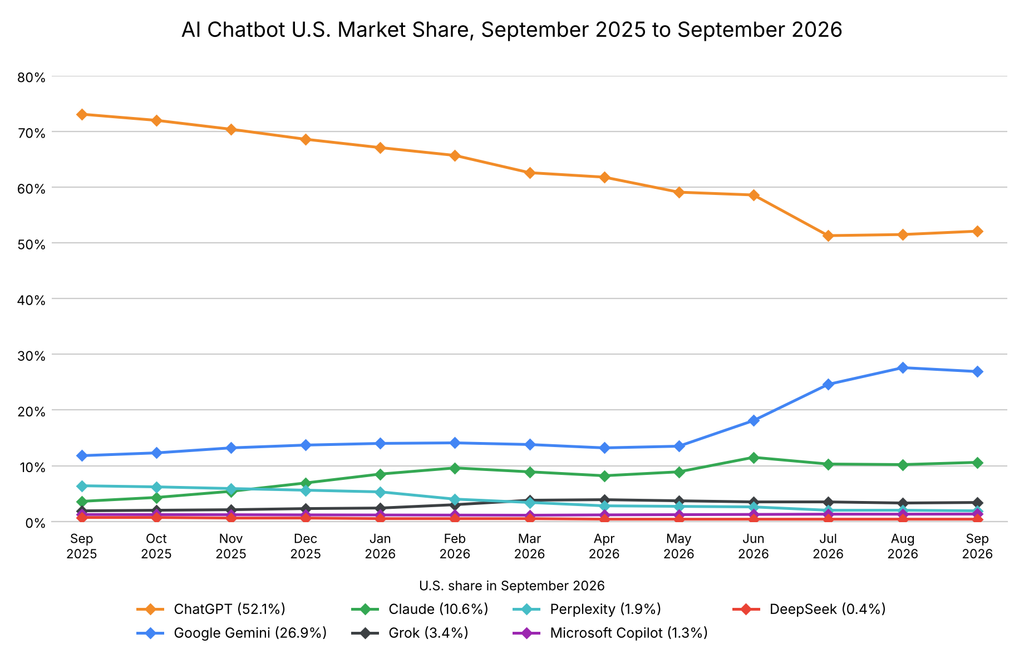
- Gemini made the largest gain. We found that its share held between 11.8% and 14.1% through May, then doubled to 27.6% by August before easing to 26.9% in September.
- Claude nearly tripled its share. Our data showed Claude rising from 3.6% to 10.6%, passing Perplexity in December 2025 and peaking at 11.5% in June.
- The smaller chatbots moved in different directions. We found that Perplexity fell from 6.4% to 1.9%, Grok rose from 1.9% to 3.4% and passed Perplexity in March, and Microsoft Copilot and DeepSeek each stayed below 1.5%.
ChatGPT Retention Rate by Subscription Tier
We tracked subscribers who joined in September 2025 and measured how many maintained an active paid subscription at 3, 6, and 12 months. Retention counts accounts that kept their current tier or upgraded; continued app usage alone does not qualify. These figures are based on self-reported data and should be read as directional, since OpenAI does not publish tier-level retention.
| Subscription Tier | 3 Months | 6 Months | 1 Year |
| ChatGPT Plus | 72% | 62% | 57% |
| ChatGPT Business (formerly Team) | 85% | 78% | 69% |
| ChatGPT Enterprise | 96% | 93% | 90% |
The main trend in the data is that retention rises with organizational depth. ChatGPT Plus subscribers churn at more than four times the enterprise rate, losing 43% within a year versus 10%. At that level, ChatGPT is less like a product enterprises are still trialing and more like an embedded workflow tool they’ve committed to. For a business weighing whether to standardize on ChatGPT, that retention is reassuring: other organizations aren’t abandoning it after committing.
The three tiers behave like separate markets:
- Plus tier shows soft retention. It is cheap to join or leave, so users switch easily to alternatives such as Gemini and Claude.
- Business tier retention lands at 69% at one year, as shared workflows raise switching costs.
- Enterprise retention remains near 90%, as multi-year contracts and restructured workflows make switching costly.
The deeper a company wires ChatGPT into its workflows, through custom GPTs, shared prompt libraries, and connected data, the more expensive it becomes to replace. That switching cost most likely explains why enterprise retention holds while consumer retention slips. This is OpenAI’s core advantage because even if it loses general consumer share to Gemini and Claude, it can maintain a strong enterprise user base.
ChatGPT Visitor Share by Country: October 2026
ChatGPT’s user base is global, but it’s unevenly distributed. The table below ranks countries by their share of ChatGPT visits, led by the US and India, with Brazil a distant third.
ChatGPT Visitor Share by Country (October 2026)
| Country | Share Of ChatGPT Visitors |
| United States | 18.2% |
| India | 10.1% |
| Brazil | 5.7% |
| Japan | 4.2% |
| Canada | 3.7% |
| United Kingdom | 3.1% |
| France | 3.1% |
| Mexico | 2.8% |
| Germany | 2.7% |
| Spain | 2.4% |
| Philippines | 2.3% |
| Italy | 2.2% |
| Australia | 1.6% |
| Colombia | 1.4% |
| South Korea | 1.3% |
| Argentina | 1.2% |
While the largest share of ChatGPT’s traffic still comes from the US, international growth is accelerating. However, revenue growth in these markets has not kept pace because most new international users opt for the free tier or the $8 Go plan. Paying customers therefore remain concentrated in wealthier English-speaking countries.
Beyond the leading markets, Brazil, Mexico, the Philippines, and Colombia are all adding ChatGPT users, while Kenya leads globally in per-capita adoption. Overall, user traffic is becoming more geographically diverse.
ChatGPT Purchasing Trends: October 2026
In the table below, we list the top industries where customers use ChatGPT to help with purchases. Financial impact refers to the estimated transaction value ChatGPT influenced within each industry, not revenue earned by OpenAI.
Top Industries Using ChatGPT to Make Purchases (October 2026)
| # | Industry | % of Customers Using ChatGPT in Purchasing Journey | ChatGPT’s Estimated Financial Impact by Industry |
| 1 | Travel & Hospitality | 47% | $1.52 trillion |
| 2 | Retail & CPG | 37% | $1.15 trillion |
| 3 | IT Services | 35% | $987 billion |
| 4 | Lifestyle, Health & Wellness | 33% | $899 billion |
| 5 | Food & Beverage | 32% | $546 billion |
| 6 | Home Services | 31% | $390 billion |
| 7 | Healthcare | 30% | $378 billion |
| 8 | Automotive | 30% | $243 billion |
| 9 | B2B SaaS | 29% | $229 billion |
| 10 | Advertising & Marketing | 28% | $156 billion |
| 11 | Fintech | 27% | $135 billion |
| 12 | Insurance | 25% | $104 billion |
| 13 | Real Estate | 21% | $66 billion |
| 14 | Financial Services | 21% | $21.7 billion |
| 15 | Education | 19% | $12.6 billion |
Adoption is highest in industries where research, comparison, and at least part of the transaction can be completed online. Travel & Hospitality leads at 47%, consistent with a buying journey that is digital from initial research through booking. Education has the lowest adoption rate, at 19%, followed by Financial Services and Real Estate at 21% each. These sectors often involve complex decisions, regulatory requirements, high levels of trust, or substantial human and institutional involvement, which can make buyers less likely to rely on ChatGPT alone.
Financial impact reflects estimated transaction value, not adoption alone, so industries with similar adoption rates can differ widely in dollar terms. Real Estate and Financial Services both show 21% adoption, yet their estimated impacts are $66 billion and $21.7 billion, respectively, mainly because of differences in average transaction value and purchasing volume.
Overall, ChatGPT’s commercial impact is strongest in industries where buyers need to compare options and feel confident before deciding. More buyers now start with ChatGPT to narrow their choices, then move to a company’s website, sales team, or booking platform to take the next step.
Requesting a Copy of This Report
If you’d like a PDF copy of this report, you can reach out here.
Related Reading
- Top Generative AI Chatbots by Market Share
- Which Industries Use Generative AI To Make Purchases?
- ChatGPT Optimization: 2026 Guide
- Generative Engine Optimization (GEO): Explanation & Algorithm Breakdown
- Generative Engine Optimization (GEO) Strategy Guide