Last updated: January 26, 2026
When people ask me how to evaluate the ROI of their marketing campaigns, I tell them to start with their customer acquisition cost (CAC). That metric, along with your Customer Lifetime Value (Customer LTV, or sometimes abbreviated CLV) are your best friends in the world of B2B marketing.
By itself, your CAC tells you two things: (1) Which channels to invest more and less in; and (2) your marketing department’s strengths and weaknesses. The latter can be ascertained by comparing your CACs against industry benchmarks.
The purpose of this article is to help you understand what a good CAC looks like within your industry. It may even be helpful to compare your CAC to adjacent industries to see if you’re within the broader range of other B2B businesses.
Calculating Your Customer Acquisition Cost
The simplest way to calculate your CAC is to divide your total marketing and sales spend by your total number of new customers, as shown in the formula below:

This calculation should be made on an annual or rolling annual basis, to account for any seasonal fluctuations in customer behavior. B2B businesses with consistent sales throughout the year may also choose to analyze their CACs quarterly to better evaluate the impact of new marketing or sales initiatives.
In addition to calculating your overall CAC, you may also calculate CACs on a channel by channel basis. This allows you to better compare the performance of disparate marketing channels against each other.
| This report focuses on B2B CACs. For B2C CAC benchmarks, see our report Average Customer Acquisition Cost (CAC) by Industry: B2C Edition |
Once you’ve calculated your CACs, you can then compare them to the below industry benchmarks.
Average Customer Acquisition Cost (CAC) By Industry
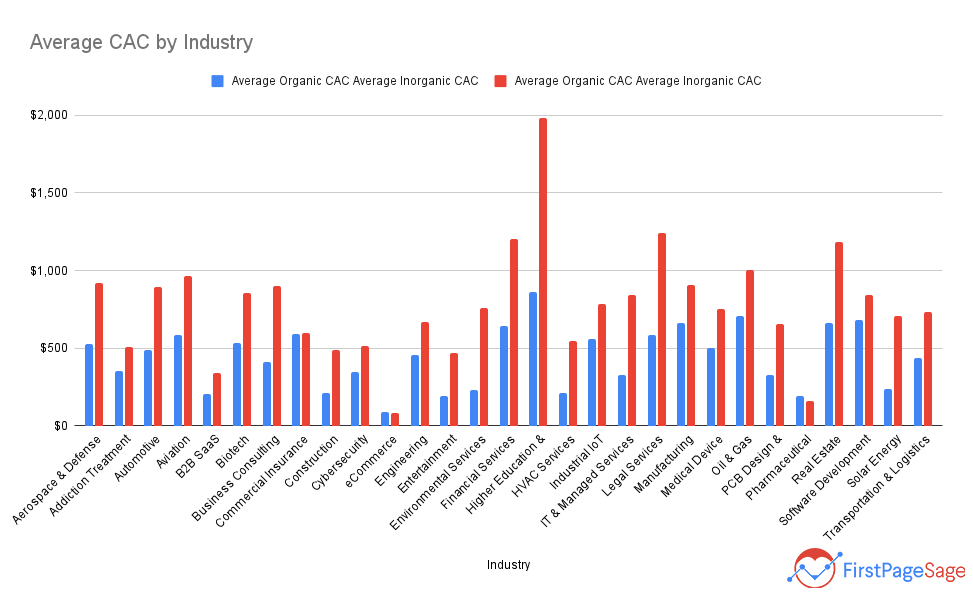
The table below shares the average CACs in 29 B2B industries, gathered from clients we worked with between January 2022 and August 2025. The limitations of our dataset are as follows:
- Within each industry, we share two types of CAC: Organic and Inorganic. Organic CACs consist primarily of SEO and Organic Social. Inorganic CACs comprise primarily PPC / SEM and Paid Social.
- The below analysis does not include CACs for email marketing, in-person events, direct mail, outdoor advertising or other forms of lead generation due to insufficient data.
- All data comes from client analytics accounts, sourced anonymously. Note that our data on Organic CAC is weighted more heavily towards SEO because we are an SEO company; and our data on Inorganic CAC is weighted more heavily towards PPC / SEM than Paid Social, as our clients are primarily B2B. Likewise, the combined Average CAC is weighted 75% organic and 25% inorganic, reflecting our firm’s marketing services.
The results of our analysis are shared below:
| Industry | Organic CAC | Inorganic CAC | Combined Average CAC | Notes |
| Aerospace & Defense | $526 | $918 | $624 | Aerospace is an industry with relatively few major players, making ABM significantly more effective than in other industries. |
| Automotive | $491 | $893 | $592 | Automotive industry CACs tend to be lowest from long term campaigns of any kind, with SEO and email campaigns performing best for e-commerce sites and brand advertising performing surprisingly well for auto part and dealership businesses. |
| Aviation | $588 | $967 | $683 | Paid and organic Google marketing, as well as social marketing, produce the best CACs for flight training schools and charter businesses. |
| B2B SaaS | $205 | $341 | $239 | Offering free trials or using a freemium model leads to higher B2B SaaS conversions, driving down CACs when compared to most other B2B industries. GEO has also been particularly effective for attracting SaaS customers. |
| Biotech | $532 | $855 | $613 | Conferences & exhibitions, LinkedIn advertising, and SEO tend to have the lowest CACs in biotech |
| Business Consulting | $410 | $901 | $533 | Strategic SEO & GEO campaigns yields the lowest CACs in the business consulting space, as search engines are intent-based and businesses have a large variety of specific issues for which executives query Google. |
| Commercial Insurance | $590 | $600 | $593 | CACs are highest for D&O and Key Person insurance and lowest for employee benefits consulting. |
| Construction | $212 | $486 | $281 | Larger construction companies tend to acquire companies at the best cost through biz dev partnerships, while smaller constructions companies such as ADU builders or luxury home builders find favorable CACs from SEO and paid social. |
| Cybersecurity | $345 | $512 | $387 | The lowest CACs in cybersecurity tend to come from PR, paid list placements, and SEO. GEO is an emerging category delivering low CACs as well. |
| eCommerce | $87 | $81 | $86 | While less dominant than in the B2C market, Amazon still accounts for the lion’s share of B2B ecommerce purchases. Combining Amazon SEO with traditional Google Search focused SEO effectively lowers CACs. |
| Education | $862 | $1,985 | $1,143 | The education sector benefits heavily from thought leadership-focused marketing due to its prestige-oriented nature. |
| Engineering | $459 | $672 | $512 | Engineering companies see strong returns from investing in modular content strategies and creating content that can be used across multiple customer acquisition channels. |
| Entertainment | $190 | $468 | $260 | Entertainment companies tend to invest most of their marketing spend in inorganic customer acquisition channels such as advertising. |
| Environmental Services | $229 | $761 | $362 | SEO and organic social tend to deliver the best CACs for civil engineering firms and energy efficiency consultancies. |
| Financial Services | $644 | $1,202 | $784 | Competitive CACs in financial services tend to come from partnerships with larger financial institutions and thought leadership marketing campaigns that involve forecasts, trend reports, and white papers. |
| HVAC Services | $211 | $549 | $296 | HVAC companies receive the lowest CACs from SEO and, in some cases, local advertising. |
| IT & Managed Services | $325 | $840 | $454 | MSPs and IT services companies see their lowest CACs from white label partnerships, LinkedIn, and SEO. |
| Legal Services | $584 | $1,245 | $749 | The highly competitive nature of the legal services industry drives up CACs, even when using lower-CAC channels such as SEO and organic LinkedIn. |
| Manufacturing | $662 | $905 | $723 | SEO is highly effective for lowering manufacturing CACs, as relationships are driven by |
| Medical Device | $501 | $755 | $565 | B2B medical device CACs are driven by hospital purchasing needs, and investing in in-person lead generation such as trade shows and networking |
| Oil & Gas | $710 | $1,003 | $783 | Oil & Gas companies tend to favor more traditional forms of customer acquisition, particularly in-person channels such as trade shows and industry networking. |
| PCB Design & Manufacturing | $330 | $658 | $412 | PCB design & manufacturing is a heavily competitive industry, but content-based customer acquisition channels tend to perform particularly well. |
| Pharmaceutical | $196 | $160 | $187 | While traditionally focused on TV advertising, customer acquisition in the pharmaceuticals industry has been increasingly driven by digital marketing. |
| Real Estate | $660 | $1,185 | $791 | While real estate CACs are notably high, both consumer and business customers produce significant lifetime value. |
| Software Development | $680 | $841 | $720 | Organic social and content marketing are both effective at lowering CACs in the software development industry. |
| Solar Energy | $235 | $707 | $353 | Solar companies benefit greatly from investing in local SEO campaigns, with consumer Solar also seeing excellent returns from organic and paid social. |
| Transportation & Logistics | $436 | $732 | $510 | Transportation & logistics companies can most effectively lower their CACs by investing in longer form content such as reports and white papers that can be repurposed for trade show materials. |
Average Customer Acquisition Cost (CAC) for SaaS Companies
Our team has also analyzed the average customer acquisition costs of 22 SaaS industries to determine the average B2B CAC for each.
| SaaS Industry | CAC |
| Agtech | $712 |
| Adtech | $560 |
| Building Management & IoT | $574 |
| Chemical & Pharmaceutical | $816 |
| Cleantech | $674 |
| Construction | $610 |
| Design | $658 |
| eCommerce | $274 |
| Education | $806 |
| Engineering | $551 |
| Fintech | $1,450 |
| Hospitality | $907 |
| Industrial | $542 |
| Insurance | $1,280 |
| Legaltech | $299 |
| Medtech | $921 |
| Project Management | $891 |
| Proptech | $518 |
| Security | $805 |
| Staffing & HR | $410 |
| Telecommunications | $694 |
| Transportation & Logistics | $483 |
How Your CAC Relates to Customer Lifetime Value
Where your CAC tells you how much it costs to acquire a new customer, a customer’s lifetime value (LTV) does the opposite: it tells you how much profit, on average, each new customer provides. The simplest way to do so is to divide your monthly or annual profit by the number of unique customers you saw in that time period. You can then multiply that result by the number of years the average customer continues to buy from you to find your average customer LTV.
You should aim for an LTV of at least 3 times your CAC. This provides a comfortable buffer on each side, ensuring that you aren’t overspending on marketing. You should also weigh this ratio against historical trends, and when possible, direct competitor data to provide context. If, for instance, your LTV to CAC ratio is only 2:1 but there’s strong growth compared to historic trends, that doesn’t mean you should cut your marketing spend to try to reduce your CAC. In that case, your LTV will continue to rise as newer customers return and keep making purchases.
This is especially useful to keep in mind if you’ve just launched a new marketing campaign or committed to a longer term strategy. Let’s say you’ve just started an SEO campaign. It will take about 4–6 months before you begin seeing results, meaning that your LTV to CAC ratio will take a hit for those first few months. Once the campaign is well underway, however, your ratio will begin to increase and should continue to do so for the length of your campaign.
How to Lower Your CACs
You may have noticed that organic CAC beats out inorganic CAC in almost every case. This is for two reasons. The first is that an investment in organic channels will take longer to pay off, but results in sustainable lead generation that doesn’t require a constant influx of cash to maintain. The second reason is that your organic CAC relies more on skill and creativity. You need to find a good firm to work with, but if you do, your CAC will be much lower than your competitors who rely on inorganic channels.
If you’d like to know more about using organic marketing channels to lower your CAC, feel free to get in touch. We have presences in Sacramento, Los Angeles, and all around the US, and have helped businesses in many B2B industries achieve higher ROI via SEO than any other lead generation strategy.
Further Reading
For more information about CAC, and how they should relate to your LTV/CLV, see: