Last updated November 4, 2026
The following report was compiled from client data and research on 122 of our agency’s accounts from December 2021 through October 2026, covering customer acquisition cost (CAC) across 21 marketing channels.
CAC by channel shows which lead generation channel earns its budget. An LTV-to-CAC ratio of 3:1 is generally healthy, meaning a company pays $1 to make $3 in revenue. These CACs represent a five year average, which typically includes a 4 to 6 month learning period where CAC is much higher. The benchmarks were achieved in high-performing campaigns carried out by our agency, so they may run below what a typical company sees. In the sections below, we break down CAC by channel, compare organic and inorganic averages, and rank the lowest cost channels.
CAC by Marketing Channel, Organic and Inorganic
In the table below, we break down B2B and B2C CAC for each organic and inorganic channel in our dataset.
CAC by Marketing Channel, Organic and Inorganic, 2026
| Marketing Channel | B2B CAC | B2C CAC |
| ORGANIC MARKETING CHANNELS | ||
| Thought Leadership SEO | $686 | $316 |
| E-mail Marketing | $541 | $304 |
| Social Media Marketing | $697 | $225 |
| Content Marketing | $1,254 | $890 |
| Basic SEO | $1,893 | $1,273 |
| Podcasts | $1,472 | $363 |
| Informal Networking | $711 | $472 |
| Webinars | $603 | $251 |
| Public Speaking | $518 | $472 |
| Industry Trade Shows | $1,390 | $535 |
| Video Marketing | $815 | $301 |
| Average for All Organic Channels | $962 | $491 |
| INORGANIC MARKETING CHANNELS | ||
| PPC / SEM | $778 | $281 |
| PR | $1,720 | $379 |
| Account Based Marketing (ABM) | $4,664 | N/A |
| Direct Mail | $864 | $347 |
| Outdoor Advertising | $1,690 | $301 |
| SDRs | $1,980 | N/A |
| LinkedIn Ads | $1,041 | N/A |
| Facebook Ads | N/A | $223 |
| Radio Ads | $2,430 | $375 |
| TV Ads | $2,028 | $306 |
| Average for All Inorganic Channels | $1,911 | $316 |
Our researchers took three main points from this data:
- We found Account Based Marketing the most expensive channel at $4,664 for B2B companies.
- Our data showed Basic SEO the most expensive organic channel for both audiences, at $1,893 and $1,273, while thought leadership content costs far less at $686 and $316.
- We found B2C CACs below B2B CACs on every channel with data for both.
Average CAC for Organic and Inorganic Marketing Channels
In the table below, we compare the averages for organic and inorganic channels. The graphs beneath it plot each channel from the main table.
Average CAC for Organic and Inorganic Marketing Channels, 2026
| Channel Type | B2B CAC | B2C CAC |
| Organic | $962 | $491 |
| Inorganic | $1,911 | $316 |
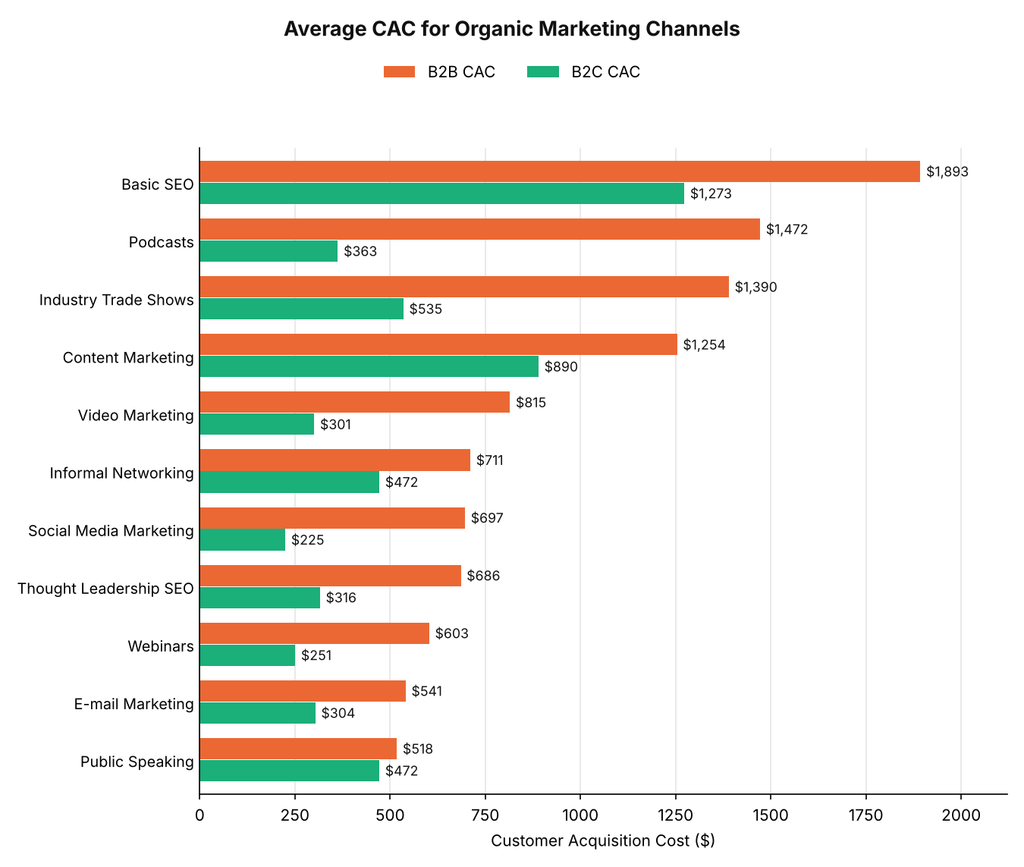
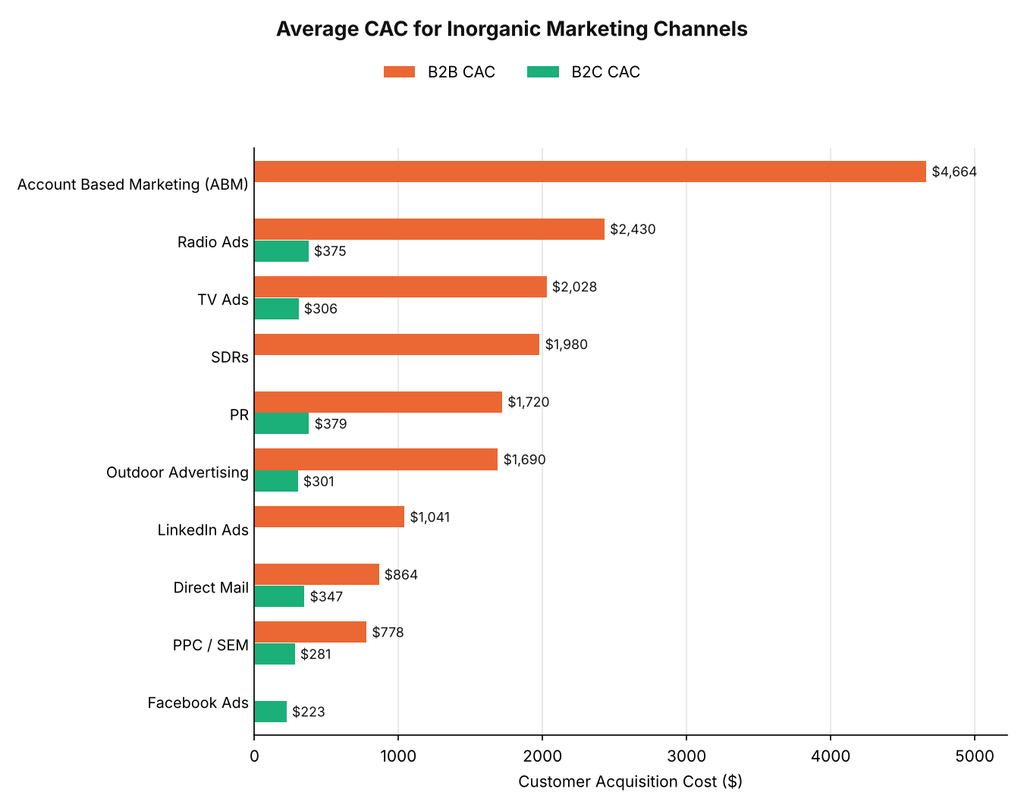
Our team drew three conclusions from this data:
- We found inorganic channels costing about twice as much as organic channels for B2B companies, at $1,911 against $962.
- Our data showed the reverse for B2C companies, where organic channels average $491 and inorganic channels $316.
- We suspect Basic SEO and Content Marketing lift the B2C organic average, since most other organic channels sit below $500.
Lowest CAC Marketing Channels
In the table below, we rank the five lowest cost channels for B2B and B2C companies.
Lowest CAC Marketing Channels, 2026
| Rank | B2B Channel | B2B CAC | B2C Channel | B2C CAC |
| 1 | Public Speaking | $518 | Facebook Ads | $223 |
| 2 | E-mail Marketing | $541 | Social Media Marketing | $225 |
| 3 | Webinars | $603 | Webinars | $251 |
| 4 | Thought Leadership SEO | $686 | PPC / SEM | $281 |
| 5 | Social Media Marketing | $697 | Outdoor Advertising and Video Marketing | $301 |
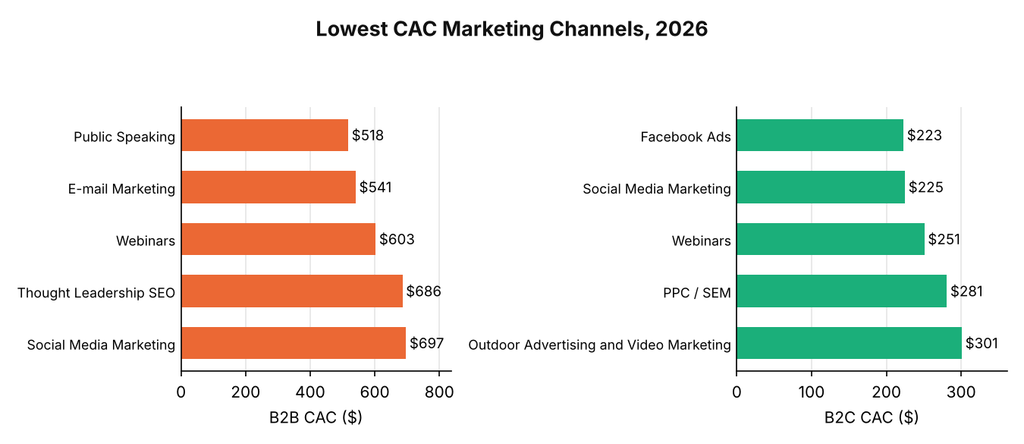
Three findings stood out to our team:
- We found every channel in the B2B top five to be organic.
- Our data showed Facebook Ads and Social Media Marketing within $2 of each other at the top of the B2C ranking.
- We found Webinars ranking third for both audiences.
If you want to lower your CAC, a strong SEO strategy is a good place to start. For more on this topic, see our reports on average CAC by industry, average CAC for SaaS businesses, the SaaS LTV to CAC ratio, and average customer lifetime value.
Requesting a Copy of This Report
If you’d like to request a PDF copy of this report or learn more about our agency, you can reach out here.
- First Page Sage Research Study. First Page Sage. November 2026. San Francisco, California.
- Customer Acquisition Cost Trends: 2026 Report. Focus Digital. 2026. Greensboro, North Carolina.
- The 2026 SaaS Benchmarks Report. Ryan Allis, SaasRise. June 2026.
- Customer Acquisition Cost in 2026, Channel by Channel. New Life Marketing. 2026.