Last updated November 4, 2026
The following report was compiled from client data and research from 2019 through October 2026, covering LTV to CAC ratio benchmarks in 30 industry categories.
The LTV to CAC ratio is a core KPI that compares what a customer returns over their lifetime with what that customer cost to acquire. The most common benchmark is 3:1, meaning an average business spends about one-third of a customer’s lifetime revenue to acquire that customer. Ratios vary by industry, with commercial insurance, higher education, and pharmaceutical companies seeing higher ratios on average than most. In the sections below, we break down benchmarks by industry, explain how to read them, and outline how to improve the ratio.
LTV to CAC Ratio Benchmarks by Industry
In the table below, we break down LTV, CAC, and the resulting ratio for each category, averaged over a three year period. In the underlying data, 68% was obtained from organic marketing channels and 74% from B2B firms.
LTV to CAC Ratio Benchmarks by Industry, 2026
| Industry | LTV Benchmark | CAC Benchmark | LTV:CAC Ratio |
| Addiction Treatment | $1,726 | $432 | 4:1 |
| Aerospace & Defense | $3,249 | $722 | 4.5:1 |
| Automotive | $2,076 | $692 | 3:1 |
| Aviation | $2,721 | $778 | 3.5:1 |
| Biotech | $2,774 | $694 | 4:1 |
| Business Consulting | $2,622 | $656 | 4:1 |
| Commercial Insurance | $2,975 | $595 | 5:1 |
| Construction | $1,396 | $349 | 4:1 |
| Cybersecurity | $1,712 | $429 | 4:1 |
| eCommerce | $255 | $84 | 3:1 |
| Engineering | $1,972 | $566 | 3.5:1 |
| Entertainment | $823 | $329 | 2.5:1 |
| Environmental Services | $1,485 | $495 | 3:1 |
| Financial Services | $3,692 | $923 | 4:1 |
| Higher Education & College | $7,118 | $1,424 | 5:1 |
| HVAC Services | $1,140 | $380 | 3:1 |
| Industrial IoT | $2,680 | $673 | 4:1 |
| IT & Managed Services | $2,039 | $583 | 3.5:1 |
| Legal Services | $4,117 | $915 | 4.5:1 |
| Manufacturing | $2,351 | $784 | 3:1 |
| Medical Device | $2,512 | $628 | 4:1 |
| Oil & Gas | $2,570 | $857 | 3:1 |
| PCB Design & Manufacturing | $2,223 | $491 | 4.5:1 |
| Pharmaceutical | $890 | $178 | 5:1 |
| Real Estate | $3,160 | $791 | 4:1 |
| SaaS (B2B) | $956 | $243 | 3.9:1 |
| SaaS (B2C) | $583 | $233 | 2.5:1 |
| Software Development | $3,042 | $763 | 4:1 |
| Solar Energy | $1,178 | $471 | 2.5:1 |
| Transportation & Logistics | $1,752 | $584 | 3:1 |
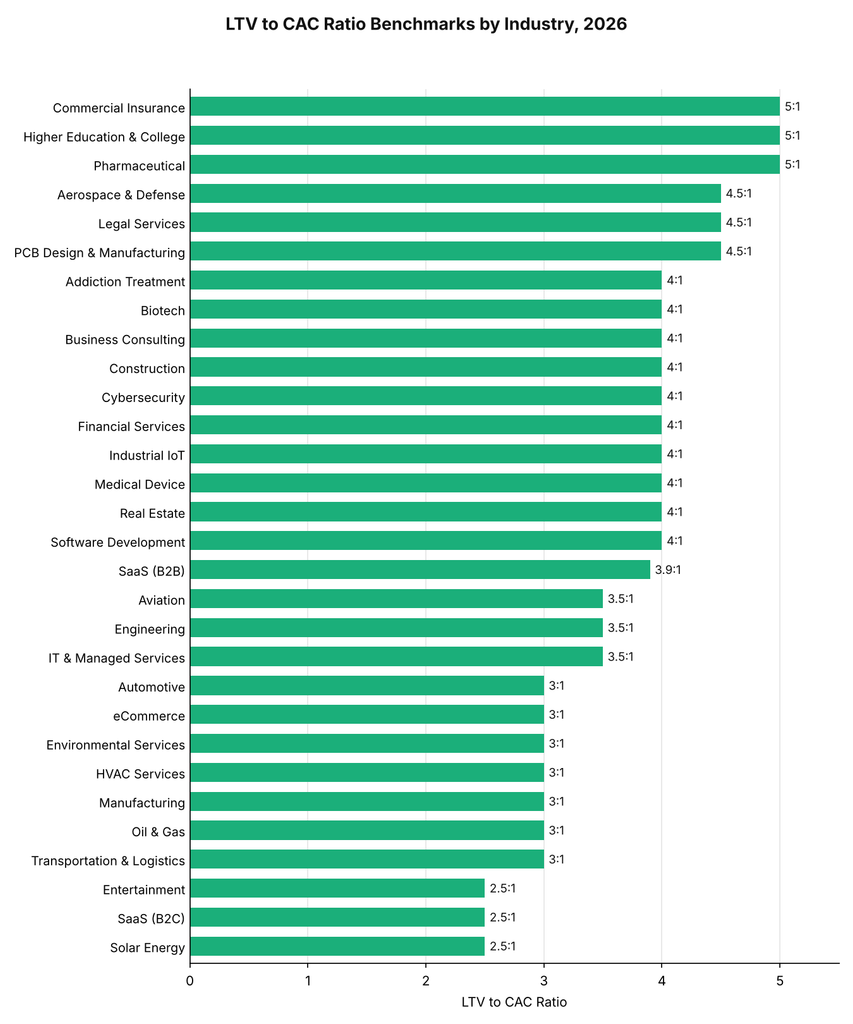
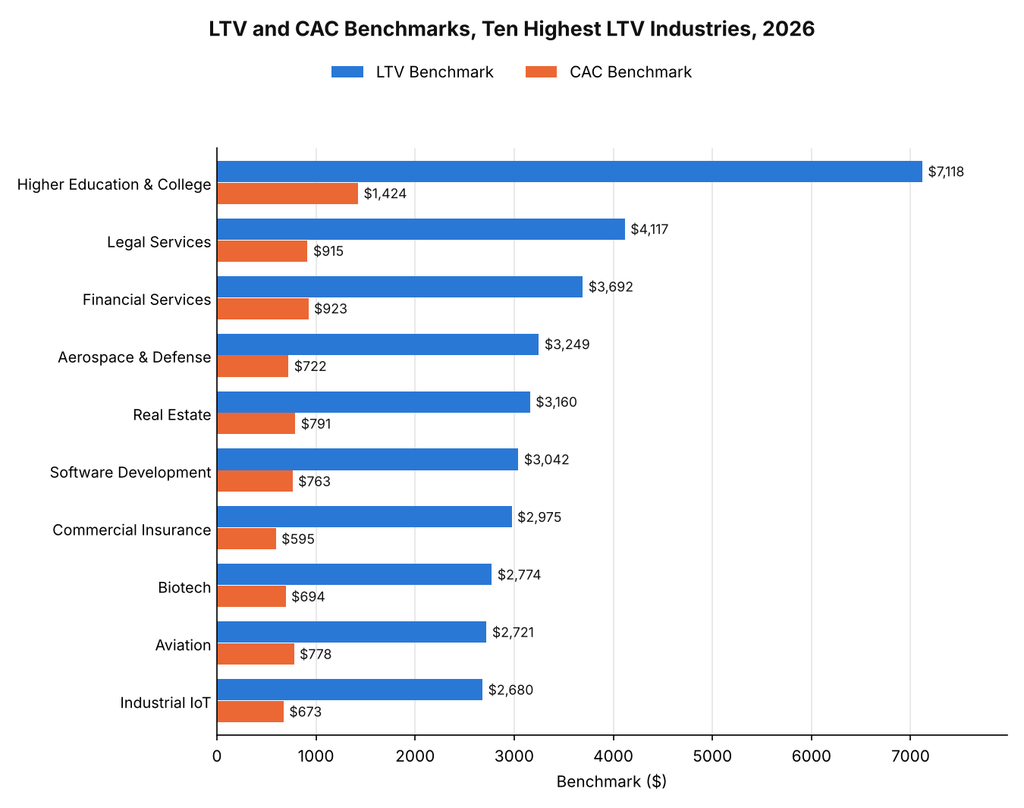
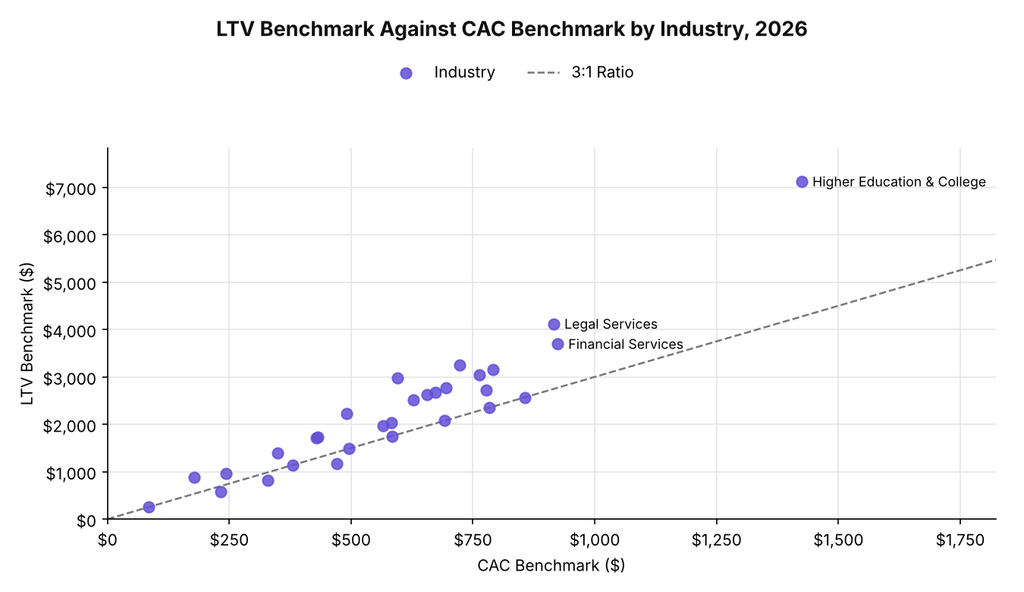
Our researchers took three main points from this data:
- We found an average ratio of 3.7:1 across the 30 categories, above the 3:1 benchmark.
- Our data showed Commercial Insurance, Higher Education, and Pharmaceutical at the top with 5:1.
- We found Entertainment, SaaS (B2C), and Solar Energy lowest at 2.5:1, the only categories below 3:1.
The Intricacies of LTV to CAC Ratios
A ratio is only as reliable as the inputs behind it. In the table below, we show how to read a result against the 3:1 benchmark.
Reading the LTV to CAC Ratio, 2026
| Ratio | What It Suggests |
| Below 1:1 | Each customer loses money |
| 1:1 to 3:1 | Returns are thin, and churn or acquisition costs deserve review |
| 3:1 | The standard benchmark |
| Above 3:1 | Healthy, though a very high ratio may signal underinvestment in growth |
Our team offers three points on measurement:
- We recommend calculating CAC over a substantial length of time, ideally as an annual rolling average, so seasonal swings and new campaigns do not distort it.
- We found that LTV and CAC benchmarks depend on the population measured, so these all-industry figures are most useful for comparing categories within this table.
- We recommend comparing against your own history as well as the industry row, because a single year can mislead.
Improving Your LTV to CAC Ratio
A company can improve the ratio by raising LTV, lowering CAC, or both. We’ve observed significant improvements when businesses primarily use organic marketing, and we suspect this is because organic channels keep producing after the initial investment. Our review of customer acquisition channels compares the options, and a combination of channels often works best.
Requesting a Copy of This Report
If you’d like to request a PDF copy of this report or learn more about our agency, you can reach out here.
- First Page Sage Research Study. First Page Sage. November 2026. San Francisco, California.
- The 2026 SaaS Benchmarks Report. Ryan Allis, SaasRise. June 2026.
- 2026 SaaS CAC Payback Report. B2Bcentr. 2026.
- LTV:CAC Ratio Benchmarks 2026. Foundry CRO. 2026.