SEO Statistics
For those newer to SEO and SEO metrics, we recommend beginning with our report on the Google Algorithm Ranking Factors to understand how Google determines which pages should rank highly, and then reading our guide discussing How to Measure SEO Results. In this guide, we cover which KPIs you should be tracking in an SEO campaign, and how to track them. We also published a guide on SEO Conversion Tracking 101, in which we discuss how to determine how many visitors to your website become leads.
Top SEO Marketing Reports

The 2025 Google Algorithm Ranking Factors
In this report, we break down the factors that impact ranking in Google's search algorithm as of Q1 2025.
Google Click-Through Rates (CTRs) by Ranking Position in 2026
In this report, we share our research on click-through rates for each organic ranking position, ad position, and search element on Google.
Clickthrough Rates (CTR) for Organic vs Paid Search
In this article, we compare the CTRs of organic vs paid search results and offer guidance on how to use each channel.
SEO Benchmarks by Industry
In this article, we use our proprietary data to share 5 SEO benchmarks for 20 industries.
SEO ROI Statistics 2026
In this post, we share SEO ROI statistics broken down by industry, further segmenting it by Return on Advertising Spend (ROAS), ROI, and time to break-even.
What is the Time Frame for Seeing SEO Results?
This article tells you how long it should take to see substantial results from an SEO campaign.
All SEO Marketing Reports
The 2025 Google Algorithm Ranking Factors
In this report, we break down the factors that impact ranking in Google's search algorithm as of Q1 2025.Google Click-Through Rates (CTRs) by Ranking Position in 2026
In this report, we share our research on click-through rates for each organic ranking position, ad position, and search element on Google.Clickthrough Rates (CTR) for Organic vs Paid Search
In this article, we compare the CTRs of organic vs paid search results and offer guidance on how to use each channel.What is the Time Frame for Seeing SEO Results?
This article tells you how long it should take to see substantial results from an SEO campaign.
Marketing ROI Statistics
ROI (Return on Investment) is the metric by which all marketing should be ultimately judged, and can be calculated using the formula below:

The following reports share our research into the expected ROI of various marketing channels:
SEO ROI Statistics 2026
In this post, we share SEO ROI statistics broken down by industry, further segmenting it by Return on Advertising Spend (ROAS), ROI, and time to break-even.
Digital Marketing ROI Statistics
In this report, we share ROI data compiled from companies who engaged in digital marketing campaigns with our firm over the past 5 years.
LinkedIn Organic Benchmarks & ROI 2025
This report contains organic benchmarks and ROI statistics for LinkedIn, compiled from 8 years of campaigns on behalf of small to midsize B2B clients with annual revenues of $5M–$250M.
Content Marketing ROI Statistics by Industry
We aggregate the data from 10+ years of content marketing for 12 industry verticals, from real estate to PCBs to financial services.
Customer Acquisition Cost Statistics
Customer Acquisition Cost, or CAC, is the average cost of acquiring a single new customer and can be calculated using the following formula:

Like ROI, CAC provides a high-level overview of the efficiency of a company’s customer acquisition efforts, and when combined with the average customer lifetime value (LTV), indicates whether they’re over or underspending on marketing and sales.
Top CAC Reports

The LTV to CAC Ratio Benchmark
This article outlines key nuances of LTV-to-CAC ratios and then provides specific benchmarks based on client data for 29 major industries.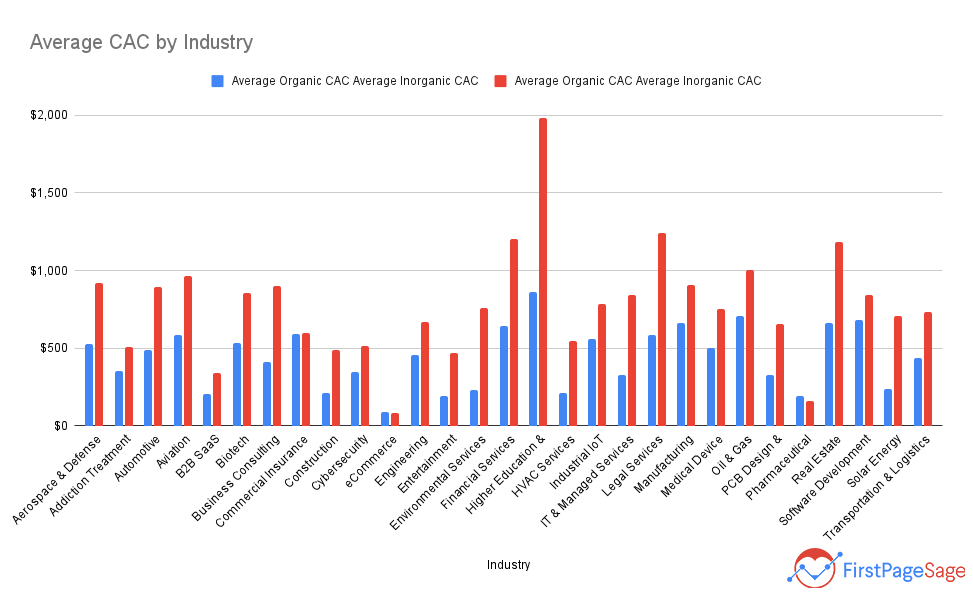
Average Customer Acquisition Cost (CAC) By Industry: B2B Edition
In this article, we show you what a good CAC looks like within your industry and help you compare your CAC to adjacent industries.
CAC by Channel – 2026 Benchmarks
In this article, we break down the average B2B and B2C CAC for organic and inorganic marketing channels.
Average CAC for SaaS Businesses, by Industry & Customer Type
In this article, we discuss the blended CAC for each SaaS industry, broken down by customer type (B2C, Small B2B, Middle Market B2B, and Enterprise).
All CAC Reports
The LTV to CAC Ratio Benchmark
This article outlines key nuances of LTV-to-CAC ratios and then provides specific benchmarks based on client data for 29 major industries.Average Customer Acquisition Cost (CAC) By Industry: B2B Edition
In this article, we show you what a good CAC looks like within your industry and help you compare your CAC to adjacent industries.CAC by Channel – 2026 Benchmarks
In this article, we break down the average B2B and B2C CAC for organic and inorganic marketing channels.Average CAC for SaaS Businesses, by Industry & Customer Type
In this article, we discuss the blended CAC for each SaaS industry, broken down by customer type (B2C, Small B2B, Middle Market B2B, and Enterprise).Average CAC for Startups: 2026 Benchmarks
Our research team calculated the average CAC for startups across 29 industries, which we further subdivided into B2B and B2C companies.Average CAC for eCommerce Companies: 2026 Edition
In this article, we share our benchmarks on average CAC for 13 ecommerce industries, as well as strategies for reducing CACs.Average Customer Acquisition Cost (CAC) by Industry: B2C Edition
In this report, we present our data on average B2C customer acquisition costs (CAC) by industry, divided by paid and organic sources.Fintech CAC Benchmarks: 2026 Report
In this report, we share fintech CAC benchmarks by industry and customer size.B2B Customer Acquisition KPIs: 2026 Report
In this article, we share the top customer acquisition KPIs for 30 B2B industries, as well as benchmarks for each.B2B SaaS Customer Acquisition Cost: 2025 Report
In this report, we share our research on B2B SaaS customer acquisition costs, divided by subindustry and company size.Average Customer Lifetime Value (LTV / CLV) for a Services Company
In this article, we share average customer lifetime value (LTV) benchmarks for services companies based on data from our 12 years of working with 200+ clients.
SaaS Marketing Statistics
Our extensive work with SaaS clients has allowed us to analyze and report on SaaS marketing statistics in more detail. Of particular note are our reports on free trial and freemium conversion rates.
Top SEO Marketing Reports

SaaS Free Trial Conversion Rate Benchmarks
In this report, we share out data on SaaS free trial (both opt-in and opt-out) and freemium conversion rate benchmarks.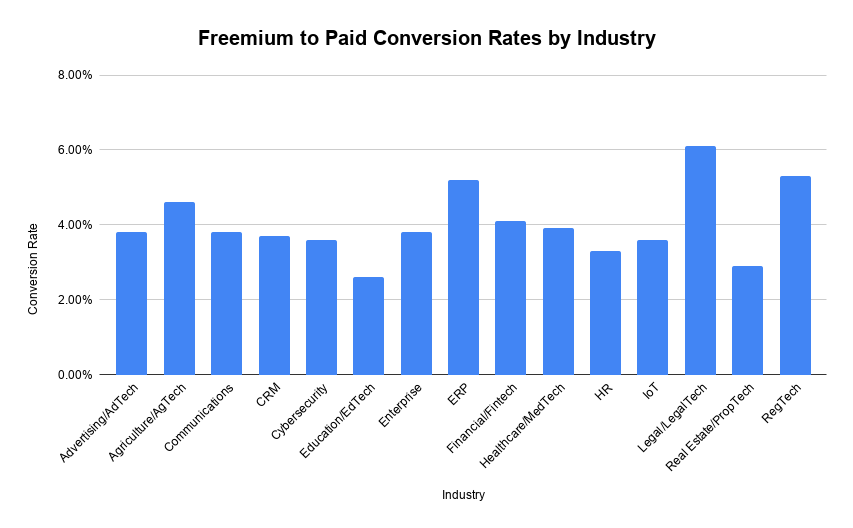
SaaS Freemium Conversion Rates: 2026 Report
The following report shares data gathered from 80+ SaaS clients we worked with who offered their product through a freemium model.Average CAC for SaaS Businesses, by Industry & Customer Type
In this article, we discuss the blended CAC for each SaaS industry, broken down by customer type (B2C, Small B2B, Middle Market B2B, and Enterprise).
SaaS Benchmarks: 2025 Report
In this report, we share 14 key metrics and benchmarks for SaaS companies, organized by their role in measuring your company's performance.
All SaaS Marketing Reports
Average CAC for SaaS Businesses, by Industry & Customer Type
In this article, we discuss the blended CAC for each SaaS industry, broken down by customer type (B2C, Small B2B, Middle Market B2B, and Enterprise).B2B SaaS Funnel Conversion Benchmarks
In this report, we provide benchmarks for marketing performance along each step of the B2B SaaS conversion funnel.B2B SaaS Marketing KPIs: Behind the Numbers
In this article, we provide benchmarks for the 7 most important B2B SaaS Marketing KPIs, and explain how to use each metric.SaaS Free Trial Conversion Rate Benchmarks
In this report, we share out data on SaaS free trial (both opt-in and opt-out) and freemium conversion rate benchmarks.SaaS Freemium Conversion Rates: 2026 Report
The following report shares data gathered from 80+ SaaS clients we worked with who offered their product through a freemium model.B2B SaaS Customer Acquisition Cost: 2025 Report
In this report, we share our research on B2B SaaS customer acquisition costs, divided by subindustry and company size.Average SaaS Conversion Rates: 2026 Report
This report summarizes our findings on average SaaS conversion rates in 2026.SaaS CAC Payback Benchmarks: 2025 Report
In this report, we share SaaS CAC payback benchmarks for a variety of SaaS industries and customer sizes.
Other Marketing Statistics
Many our reports do not fall neatly into a category above. Below are the other reports on marketing statistics that we’ve had the opportunity to create:
Top Generative AI Chatbots by Market Share – July 2026
Our team collected data on the market share of each of the major generative AI chatbots in the U.S.Google Ads: Average Clickthrough Rates in 2026
In this report, we share our research on clickthrough rates for Google ads based on our agency’s client accounts and published reports.Average Cost Per Lead by Industry – 2026
In this report, we share our data on the average cost per lead (CPL) for 30 industries, for both paid and organic channels.B2B Content Marketing Statistics
In this report, we share the data compiled from B2B companies who engaged in content marketing campaigns with our firm over the past 5 years.B2B Lead Generation Statistics
In this article, we discuss the ROI, cost, and average marketing budget percentage of the most common B2B lead generation techniques.Growth Marketing Metrics for 2026
In this article, we discuss the 10 most important metrics for growth marketing, providing benchmarks for and explaining each.Digital Marketing Benchmarks by Industry
In this article, we use our proprietary data to share digital marketing benchmarks across industries.Digital Marketing Metrics & KPIs for 2026
In this article, we share which digital marketing metrics & KPIs you should track in 2026, as well as successful campaign benchmarks for each.Digital Marketing Statistics: 2025 Compendium
In this compendium, we summarize the most notable digital marketing statistics that can be found in our previously published reports.Real Estate Marketing Metrics & Benchmarks: 2025
This guide presents the 7 marketing metrics that real estate companies tend to track, offering benchmarks and insights for each.Average Patient Acquisition Cost: 2026 Report
In this report, we share patient acquisition cost benchmarks by practice type and marketing channel used.