Last updated November 4, 2026
The following report was compiled from client data and research from 2019 through October 2026 on the LTV to CAC ratio across 10 SaaS industries.
The LTV to CAC ratio compares a customer’s lifetime value with the cost of acquiring that customer. A healthy SaaS company spends about a third of the gross profit a customer generates to win that customer. Taken too far in either direction, the ratio signals trouble: a low ratio means overspending, and a very high ratio means a company could spend more aggressively. In the sections below, we explain the ranges, share benchmarks by industry, compare low-CAC channels, and outline how to improve the ratio.
LTV to CAC Ranges Explained
In the table below, we show how to read the ratio. A ratio of 3:1 is the standard benchmark.
LTV to CAC Ranges Explained, 2026
| LTV to CAC Ratio | Status | Explanation |
| 0.5:1 | Overspending | Earns less than it costs to acquire a new customer |
| 2:1 | Needs Improvement | Reasonable profit and on track, but could do better |
| 3:1 to 4:1 | Ideal | Earns about 3 to 4 times what it spends per customer, supporting profit and long-term growth |
| 6:1 | Stable | Excellent profits, though some revenue could fund further growth |
| 8:1 | Poor Growth | Likely sacrificing long-term growth for short-term margin |
Our team offers three points on these ranges:
- We consider 3:1 to 4:1 the healthiest range for most SaaS companies, since we suspect it leaves room for operating costs and reinvestment.
- We suspect ratios above 5:1 often reflect underinvestment in growth rather than exceptional efficiency, though a strong product can also produce them.
- We recommend reading the ratio alongside growth rate, since lead generation channels such as SEO take time to pay back.
SaaS LTV-to-CAC Benchmarks
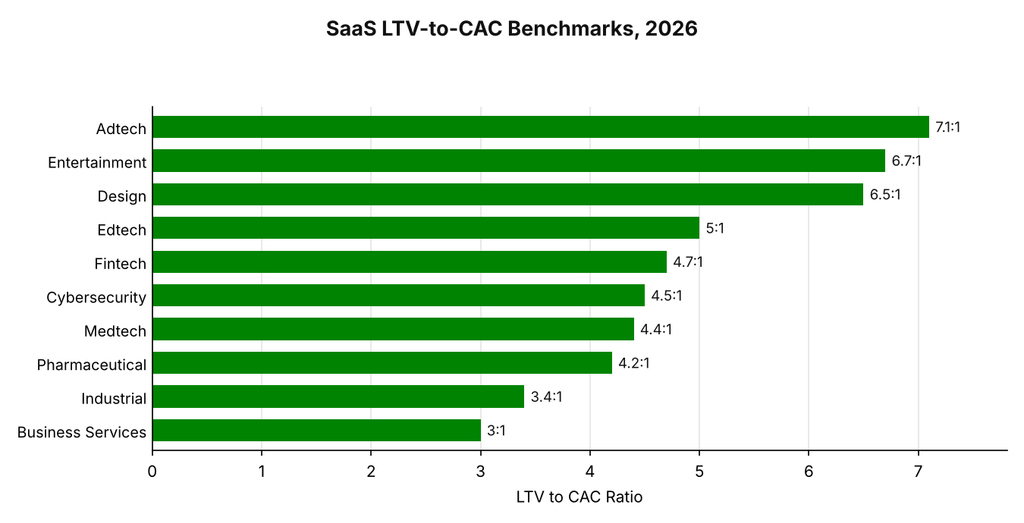
In the table below, we break down LTV, CAC, and the resulting ratio for 10 SaaS industries, as a rolling three-year average. In the underlying data, 64% is derived from organic marketing channels and 76% is from B2B SaaS companies.
SaaS LTV-to-CAC Benchmarks, 2026
| SaaS Industry | LTV Benchmark | CAC Benchmark | LTV:CAC Ratio |
| Adtech | $6,800 | $956 | 7.1:1 |
| Business Services | $2,400 | $787 | 3:1 |
| Cybersecurity | $15,500 | $3,441 | 4.5:1 |
| Design | $5,800 | $895 | 6.5:1 |
| Edtech | $7,100 | $1,431 | 5:1 |
| Entertainment | $4,080 | $612 | 6.7:1 |
| Fintech | $11,700 | $2,496 | 4.7:1 |
| Industrial | $10,800 | $3,175 | 3.4:1 |
| Medtech | $16,300 | $3,665 | 4.4:1 |
| Pharmaceutical | $11,200 | $2,689 | 4.2:1 |
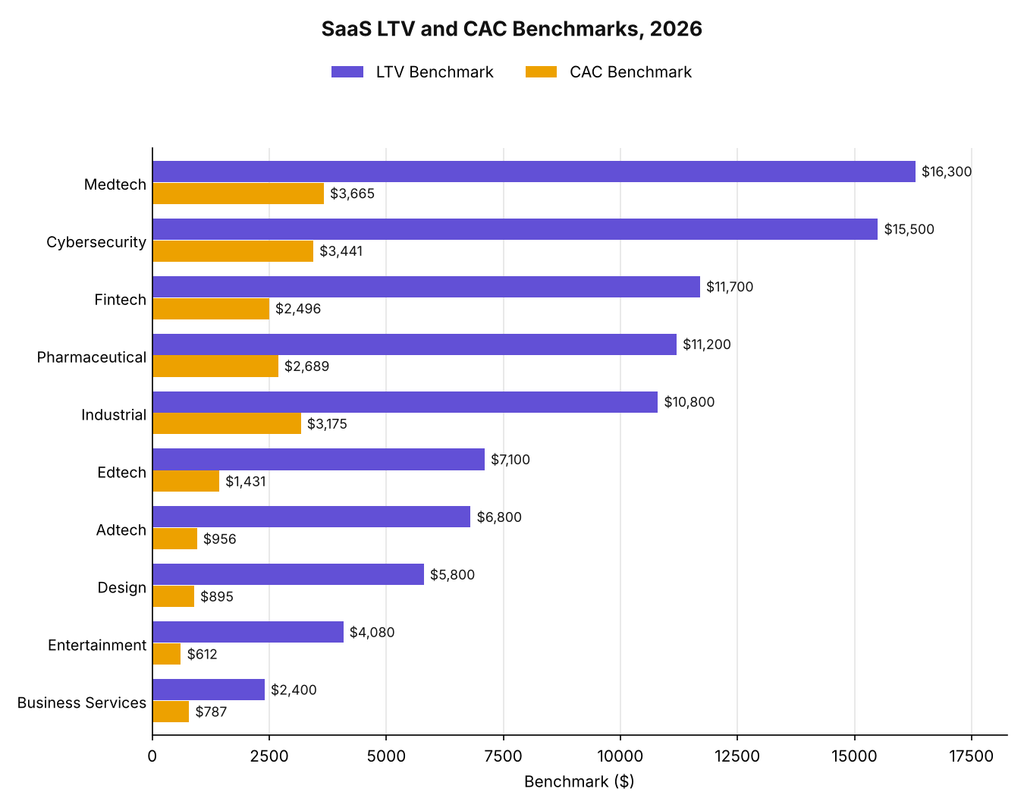
Our researchers took three main points from this data:
- We found Adtech highest at 7.1:1, followed by Entertainment at 6.7:1 and Design at 6.5:1.
- Our data showed Business Services lowest at 3:1, in line with the benchmark.
- We found an average of 5:1 across the 10 industries.
Low-CAC Marketing Channels
In the table below, we compare five channels SaaS companies commonly use to bring CAC down. See our CAC by channel report for the full list.
Low-CAC Marketing Channels, 2026
| Channel | Average CAC | Pros | Cons |
| Email Marketing | $541 | Low CAC, easy to implement | Must be combined with other channels, and good lists are hard to build |
| Webinars | $603 | Personal connection, often attended by senior decision makers | Needs a strong presenter and some hardware |
| Thought Leadership SEO | $686 | Creates warm leads through search intent | Requires expertise and takes time to build |
| LinkedIn Advertising | $1,041 | Low startup cost, audience receptive to B2B content | Takes time to gain traction and needs high-quality content |
| Trade Shows | $1,390 | In-person meetings and access to decision makers | Heavy competition for attention and significant attendance costs |
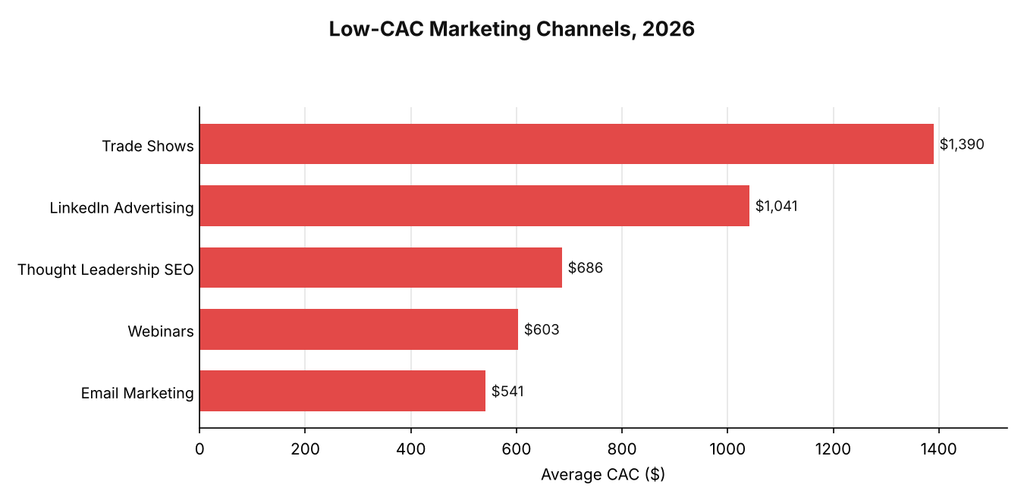
Three findings stood out to our team:
- We found Email Marketing the lowest of these five at $541, though it works best alongside other channels.
- Our data showed LinkedIn Advertising and Trade Shows carrying the highest CACs of the five, in exchange for direct access to business audiences. LinkedIn organic and public speaking are lower-cost alternatives.
- We observed that SEO campaigns take 4 to 6 months before producing notable results, so the ratio can fall early in a campaign before it improves.
Improving Your LTV to CAC Ratio
A SaaS company can improve the ratio from either side: raise LTV through retention and expansion, or lower CAC through better channels and conversion rates. Organic programs built on creativity and thoughtfulness and SEO best practices tend to lower CAC over time.
For more on this topic, see B2B SaaS funnel conversion benchmarks, average CAC for SaaS businesses, B2B SaaS marketing strategies, SEO for SaaS companies, SEO strategy for SaaS, and B2B SaaS customer acquisition cost.
Requesting a Copy of This Report
If you’d like to request a PDF copy of this report or learn more about our agency, you can reach out here.
- First Page Sage Research Study. First Page Sage. November 2026. San Francisco, California.
- The 2026 SaaS Benchmarks Report. Ryan Allis, SaasRise. June 2026.
- Customer Acquisition Cost Trends: 2026 Report. Focus Digital. 2026. Greensboro, North Carolina.
- 2026 SaaS CAC Payback Report. B2Bcentr. 2026.