Last Updated October 8, 2026
From August 4, 2025 to August 28, 2026, our research team ran a meta-analysis of clickthrough rates for Google ads. The team compiled data from 126 of our agency’s client accounts and reviewed published CTR reports for each ad type, weighting each dataset by the quality of its source and normalizing the results to U.S. query volume.
Clickthrough rate (CTR) is the share of ad impressions that result in a click. Because the presence of an AI-generated answer changes how often searchers click an ad, the search ad figures in this edition are blended across results pages with and without an AI answer.
In the sections below, we break down average CTR by ad type and then by industry.
Google Ads Average Clickthrough Rates by Ad Type
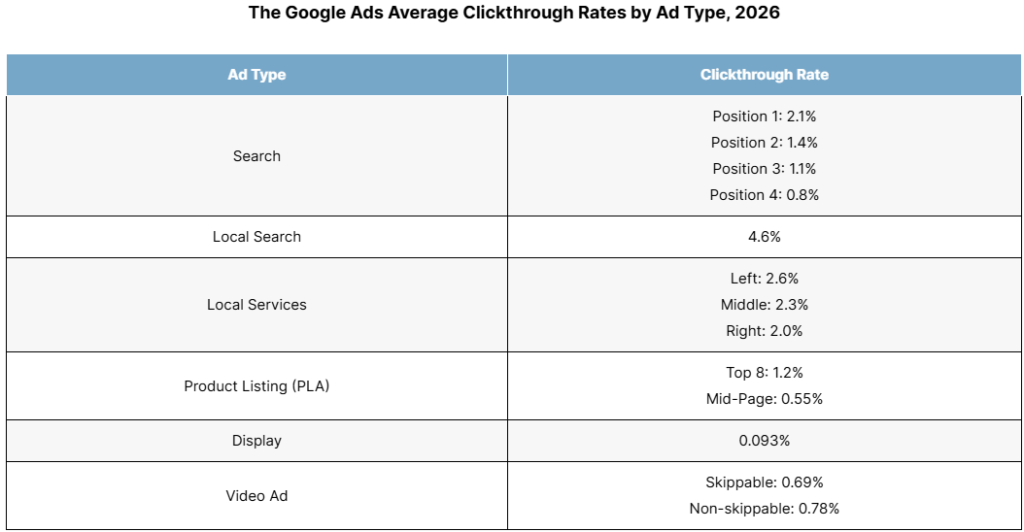
In the table below, we report the average clickthrough rate for the 6 most common Google ad types.
The Google Ads Average Clickthrough Rates by Ad Type, 2026
| Ad Type | Clickthrough Rate |
| Search | Position 1: 2.1% Position 2: 1.4% Position 3: 1.1% Position 4: 0.8% |
| Local Search | 4.6% |
| Local Services | Left: 2.6% Middle: 2.3% Right: 2.0% |
| Product Listing (PLA) | Top 8: 1.2% Mid-Page: 0.55% |
| Display | 0.093% |
| Video Ad | Skippable: 0.69% Non-skippable: 0.78% |
- We found that Local Search ads again had the highest CTR of any ad type at 4.6%, compared with 5.1% in our prior report.
- Our data showed the top search ad at 2.1%, within 0.1 points of the 2.2% we reported last year, while positions 2 and 3 rose to 1.4% and 1.1%.
- We found that product listing ads in the top 8 positions earned more than twice the CTR of mid-page listings, at 1.2% and 0.55%.
Google Search Ad Average Clickthrough Rates by Industry
During our analysis, we segmented one Google ad type, search ads, by industry. In the table below, we report the mean clickthrough rate for the top ad in the Google search results across 19 industries.
The Google Search Ad Average Clickthrough Rates by Industry, 2026
| Industry | CTR for #1 Search Ad |
| Addiction Treatment | 5.4% |
| Automotive | 2.0% |
| Aviation | 1.3% |
| CBD | 2.8% |
| Construction | 1.2% |
| eCommerce | 2.9% |
| Entertainment | 4.0% |
| Financial Services | 2.5% |
| Higher Education & College | 3.7% |
| Home Builders | 2.5% |
| Home Services | 3.0% |
| Hotels & Resorts | 3.6% |
| HVAC Services | 3.1% |
| Legal Services | 2.3% |
| Medical Device | 1.1% |
| Medical Practices | 2.1% |
| Real Estate | 2.7% |
| SaaS | 1.8% |
| Solar Energy | 2.4% |
- We found that addiction treatment had the highest CTR for the #1 search ad at 5.4%, and medical device had the lowest at 1.1%.
- Our data showed 8 of the 19 industries gaining CTR and 11 losing it since our prior report, leaving the 19-industry mean nearly flat at 2.65%, against 2.68% a year earlier.
- We found the largest gains in higher education (3.1% to 3.7%) and financial services (2.1% to 2.5%), and the largest declines in addiction treatment (5.9% to 5.4%), SaaS (2.1% to 1.8%), CBD (3.1% to 2.8%), and solar energy (2.7% to 2.4%).
Notable Google Ad CTR Statistics
- The highest CTR Google ad type is Local Search at 4.6%
- Display ads have the lowest CTR of all ad types at 0.093%, but are typically used for branding rather than to generate clicks
- The industry with the highest search ad CTR is addiction treatment (5.4%)
- The top search ad earns a 1.8% CTR on results pages with an AI-generated answer and 3.4% on pages without one, for a blended rate of 2.1%
- The #1 organic search result has 3.4x the clickthrough rate of the top search ad (7.1% against 2.1%), compared with the 5x to 20x advantage the top 3 organic results held in our prior report; the top search ad now earns a higher CTR than the #3 organic result (1.7%)
Requesting a Copy of This Report
If you’d like to request a PDF copy of this report or learn more about our agency, you can reach out here.
Related Reading
Read our 2026 report on clickthrough rates by Google ranking position, and our benchmarks for paid and organic CTRs by industry.
- First Page Sage Research Study. October 2026. San Francisco, California.
- Google Ads Benchmarks 2026: Competitive Data & Insights for Every Industry. Susie Marino, WordStream. May 19, 2026. Boston, Massachusetts.
- AIO Impact on Google CTR: 2026 Update. Tracy McDonald, Hannah Cooley, and Marketa Williams, Seer Interactive. April 24, 2026. Philadelphia, Pennsylvania.
- What Is a Good CTR for Google Ads in 2026? Vimal Bharadwaj, Optmyzr. August 28, 2026. Mountain View, California.