Last updated October 14, 2026
A high volume of free users does not necessarily translate into strong revenue, and SaaS freemium conversion rates vary considerably by industry and the type of freemium model being used. Between 2022 and 2026, we worked with 80+ SaaS clients with freemium models and analyzed their conversion data across industries and model types. Here’s what we found.
Freemium Conversion Rates by SaaS Industry
| Industry | Visitor to Freemium | Freemium to Paid |
| Advertising/AdTech | 14.3% | 3.7% |
| Agriculture/AgTech | 12.2% | 4.2% |
| Communications | 12.6% | 3.6% |
| Customer Relationship Management (CRM) | 13.8% | 3.9% |
| Cybersecurity | 12.9% | 4.4% |
| Education/EdTech | 13.1% | 2.1% |
| Enterprise | 12.3% | 3.9% |
| Enterprise Resource Planning (ERP) | 13.1% | 5.1% |
| Financial/Fintech | 13.3% | 4.8% |
| Healthcare/MedTech | 15.1% | 3.3% |
| Human Resources (HR) | 12.7% | 3.7% |
| Internet of Things (IoT) | 14.9% | 3.9% |
| Legal/LegalTech | 14.4% | 5.6% |
| Real Estate/PropTech | 11.6% | 3.3% |
| Regulatory Technology (RegTech) | 13.2% | 4.7% |
Key Takeaways for Decision Makers
Compare your company’s conversion rates to your industry’s benchmarks in the table above. A gap in visitor-to-freemium typically signals signup friction or weak positioning, while a gap in freemium-to-paid may indicate an issue in your upgrade flow or feature gating. To reduce signup friction, minimize registration fields, and clarify your value proposition on the signup page. For upgrade flow gaps, identify where free users hit feature limits and introduce contextual in-app prompts at those points.
If your team is still evaluating the freemium model, use the visitor-to-freemium rate as a demand signal and pair it with your industry’s freemium-to-paid rate to project paid subscriber volume and assess whether your model is financially viable. For example, if an industry averages a 10% visitor-to-freemium conversion rate and a 3% freemium-to-paid rate, 10,000 monthly website visitors would mean about 1,000 free users and 30 paid subscribers.
A SaaS company could then compare the expected revenue from those 30 subscribers with its acquisition and operating costs to determine whether freemium makes financial sense. If your company’s industry lands on the lower end of the conversion rate (such as EdTech at 2.1% or Healthcare/MedTech at 3.3%), you might want to consider a hybrid approach that pairs freemium with opt-in free trials.
How to Calculate Your Rate
There are two conversion rates that matter in a freemium model, and each requires its own calculation.
Visitor-to-Freemium Rate:
Visitor-to-Freemium Rate = (New Free Sign-Ups / Total Website Visitors) ×100
Freemium-to-Paid Rate:
Freemium-to-Paid Rate = (Free Users Who Converted to Paid / Total Free Users) ×100
A few common mistakes to avoid when running these calculations:
- Using too broad a conversion window (or none at all). A free user who signs up today may convert six months from now, or never. Without a defined window, typically 90 or 180 days, your freemium-to-paid rate will drift upward over time and become impossible to benchmark accurately.
- Including inactive users in the denominator. If your total free user count includes dormant accounts from years past, it will suppress your freemium-to-paid rate and make your funnel appear less efficient than it actually is. Segment by cohort (e.g., users acquired in a given quarter) for a cleaner read.
- Mixing your traffic sources. Visitor-to-freemium rates can vary significantly between organic, paid, and referral traffic. Calculating a single blended rate obscures where your funnel is performing well and where it isn’t.
Visitor-to-Freemium Rates Show Cross-Industry Consistency
Visitor-to-freemium conversion rates cluster tightly across SaaS industries. The range is just 3.5 percentage points, from 11.6% in Real Estate/PropTech to 15.1% in Healthcare/MedTech, suggesting that product positioning and perceived value have the greatest influence in getting visitors to try a free product.
Real Estate/PropTech has the lowest visitor-to-freemium rate at 11.6%, followed by Agriculture/AgTech at 12.2% and Enterprise at 12.3%. This may be because products in these categories typically involve more specialized workflows, integrations, organizational requirements, or purchasing considerations, which makes a prospective customer less inclined to try a free version that doesn’t offer these key features.
Freemium-to-Paid Rates Vary More Widely
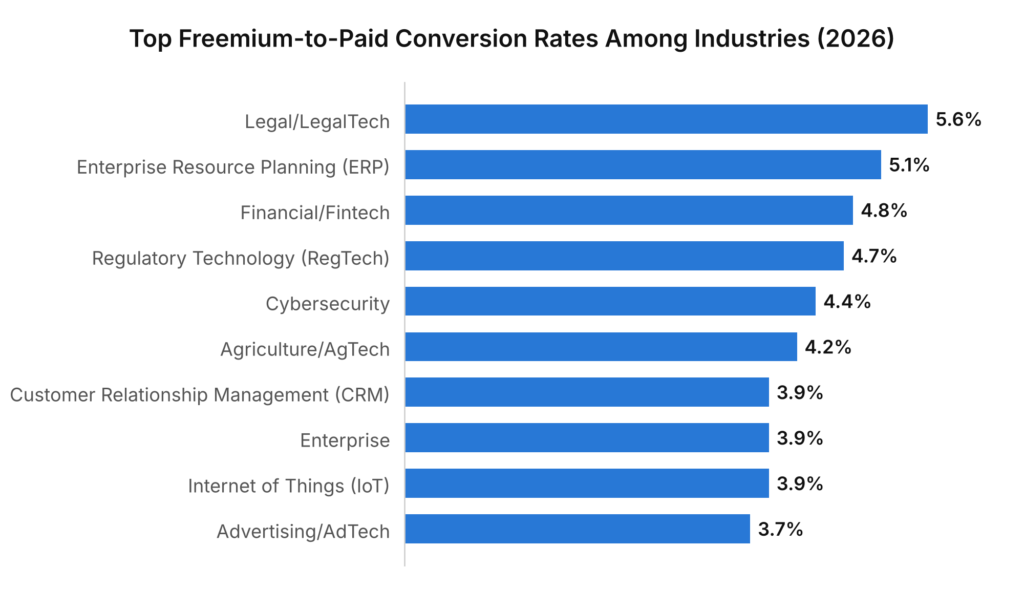
The differences become more pronounced when looking at freemium-to-paid conversion. LegalTech has the highest rate at 5.6%, followed by ERP at 5.1%, Fintech at 4.8%, and RegTech at 4.7%. These are all categories in which software can become closely tied to high-value business processes.
For these products, the free version can serve as a relatively low-risk way for users to establish that the software works for their particular workflow. Once that value is demonstrated, paying for additional functionality may be easier to justify, particularly when the software saves employees time, reduces manual work, or helps manage financial, legal, or regulatory obligations.
SaaS Free Trial vs Freemium Conversion Rates
| Freemium Model | Description | Type | Conversion Rate |
| Traditional Freemium | Free-forever software that can function on its own, but has significantly limited features compared to the paid product. | Visitor to Freemium | 12.8% |
| Freemium to Paid | 3.4% | ||
| Land & Expand | Software that is free for individuals to acquire, but which requires a paid plan to use at an organizational level. | Visitor to Freemium | 14.1% |
| Freemium to Paid | 3.7% | ||
| Freeware 2.0 | Free-forever, fully functional product with optional add-ons. | Visitor to Freemium | 13.1% |
| Freemium to Paid | 3.5% | ||
| Free Trial Type | Description | Type | Conversion Rate |
| Opt-In Free Trials | Opt-in free trials have higher visitor-to-trial conversion rates, as they don’t require visitors to input payment information before signing up. | Visitor to Free Trial | 7.6% |
| Free Trial to Paid | 17.3% | ||
| Opt-Out Free Trials | Opt-out free trials automatically convert users to paid subscriptions once the trial period ends. | Visitor to Free Trial | 2.7% |
| Free Trial to Paid | 49.1% |
Conversion Rates Among Freemium Models
Of the freemium models, Land & Expand has the highest visitor-to-freemium rate and also the highest freemium-to-paid rate. The model’s appeal is likely because users can start using the software without needing organizational approval. If an initial user sees value, the company has an opportunity to convert to a paid organizational account.
While traditional freemium plans see comparable conversion rates, their slightly lower conversions reflect the challenge of balancing enough functionality in the free product to give users value while still providing a compelling reason to upgrade.
Freeware 2.0 sits between the two. Because the core product is fully functional for free, there is less pressure to upgrade. Instead, monetization depends on optional features and add-ons becoming sufficiently valuable that users choose to pay for them.
The Tradeoff Between Acquisition and Monetization
Opt-in free trials convert 7.6% of website visitors into trial users, compared with 12.8%–14.1% for the freemium models. A freemium product allows visitors to start using software without a deadline or immediate expectation of payment. That makes the initial decision relatively easy, and it’s why freemium models are effective at getting people through the door. The tradeoff is that free users may have little urgency to upgrade, particularly if the free version remains useful for their needs.
Free trials introduce a defined period in which the user can evaluate the product. That forces users to either continue with the product as a paying customer or stop using it. Opt-out trials take this principle even further. Only 2.7% of website visitors start an opt-out trial, but 49.1% of those users convert to paid.
Requiring payment information upfront and automatically transitioning users to a paid subscription creates substantial friction at the beginning of the funnel. However, the people who overcome that friction are likely to be highly qualified and committed prospects.
Further Reading
For further reading, see our previous reports on SaaS metrics:
- SaaS Free Trial Conversion Rate Benchmarks
- B2B SaaS Funnel Conversion Benchmarks
- B2B SaaS Marketing KPIs: Behind the Numbers
- SaaS Benchmarks: 2025 Report
- The SaaS LTV to CAC Ratio
If you’d like to request a PDF copy of this report, reach out here.