Last updated November 2, 2026
From January 9, 2023 to October 26, 2026, our research team conducted a study comparing the U.S. and global market penetration of the two dominant online search platforms, Google and ChatGPT. Using a blend of client analytics, third-party usage datasets, and anonymized user behavior logs, we developed a model to estimate monthly active users (MAUs), engagement time, and share of total digital query volume.
While Google remains the longstanding leader in information retrieval, ChatGPT has rapidly expanded how people use AI for search, particularly for conversational queries and creative tasks. ChatGPT reached 1 billion monthly active users in May 2026, becoming the fastest app in history to reach that milestone, and OpenAI reported 1.2 billion weekly users on September 29, 2026. However, the Google Gemini app passed 1 billion monthly active users in August 2026, and Anthropic’s Claude and other AI chatbots are growing quickly, creating an increasingly competitive landscape.
This report provides a side-by-side Google vs ChatGPT market share analysis, beginning with a high-level comparison. In the sections below, we further segment usage by device type, demographic groups, and user intent, and close with an analysis of the broader AI chatbot competitive landscape.
Google vs ChatGPT Market Share: October 2026
In the table below, we compare global monthly active users, share of total digital queries, and average session duration for Google Search, ChatGPT, and all other platforms as of October 2026.
Google vs ChatGPT Market Share, October 2026
| Platform | Monthly Active Users (Global) | Share of Total Digital Queries | Avg. Session Duration |
| Google Search | 5.3 billion | 56.0% | 6m 04s |
| ChatGPT | 1.36 billion | 19.0% | 13m 47s |
| Other (e.g., Bing, Google Gemini) | 1.6 billion | 25.0% | 4m 44s |
- We found that Google still dominates search, handling 56.0% of global digital queries in October 2026.
- Our data showed ChatGPT with 19.0% of total digital queries and 1.36 billion global monthly active users, the most significant challenge to Google’s share of digital queries in recent years.
- Despite having roughly a quarter as many users as Google, ChatGPT held an average session duration of 13m 47s, more than twice Google’s 6m 04s, which our researchers read as a sign of deep user engagement.
Google vs ChatGPT Market Share Over Time
In the table below, we track Google and ChatGPT’s market share from Q1 2023 through October 2026. We report 2023 to 2025 quarterly and 2026 monthly, so the series reaches October without waiting for Q4 to close; each 2026 quarter’s three months average to its quarterly figure.
Google vs ChatGPT Market Share Over Time, 2023-2026
| Period | Google Share | ChatGPT Share |
| Q1 2023 | 92.8% | 1.4% |
| Q2 2023 | 92.3% | 1.5% |
| Q3 2023 | 91.8% | 1.7% |
| Q4 2023 | 91.1% | 2.1% |
| Q1 2024 | 89.8% | 2.9% |
| Q2 2024 | 88.8% | 3.4% |
| Q3 2024 | 87.4% | 4.3% |
| Q4 2024 | 85.8% | 5.4% |
| Q1 2025 | 84.0% | 6.8% |
| Q2 2025 | 81.7% | 8.6% |
| Q3 2025 | 78.6% | 14.5% |
| Q4 2025 | 77.8% | 17.1% |
| January 2026 | 77.4% | 17.3% |
| February 2026 | 76.8% | 17.7% |
| March 2026 | 77.1% | 17.5% |
| April 2026 | 77.0% | 17.8% |
| May 2026 | 76.4% | 18.2% |
| June 2026 | 76.7% | 18.0% |
| July 2026 | 76.4% | 18.4% |
| August 2026 | 75.6% | 19.0% |
| September 2026 | 76.0% | 18.7% |
| October 2026 | 75.7% | 19.0% |
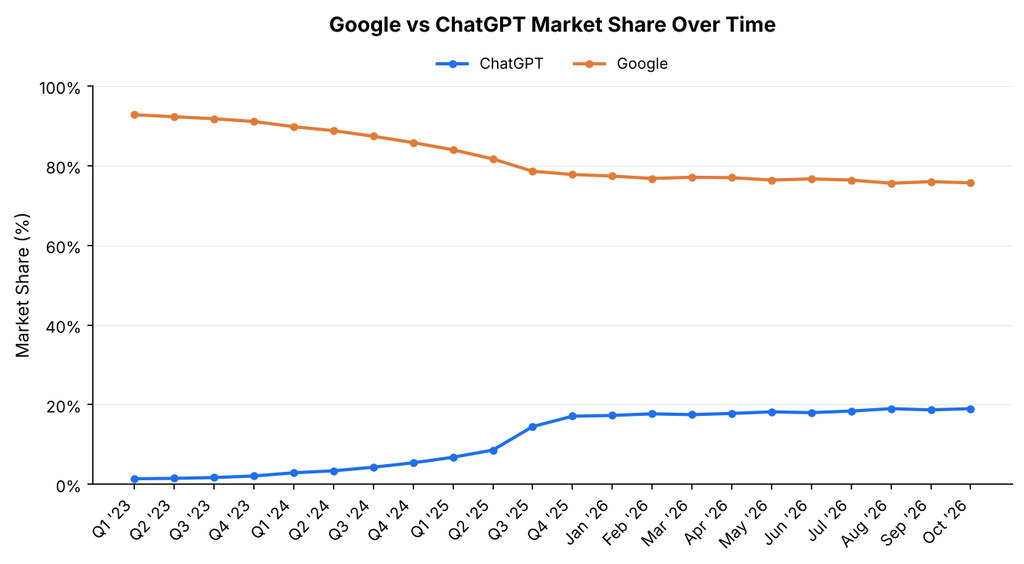
- We found that ChatGPT’s share rose from 1.4% in Q1 2023 to 19.0% in October 2026, while Google’s fell from 92.8% to 75.7% over the same period.
- Our data showed the steepest shift in 2025: ChatGPT’s share roughly doubled between Q2 2025 (8.6%) and Q4 2025 (17.1%).
- In 2026, movement has been far slower. Between Q4 2025 and October 2026, ChatGPT gained 1.9 points and Google lost 2.1 points, with month-to-month wobble rather than a steady climb.
When we break out the data by transactional queries only, which are by far the most valuable to businesses, Google is less vulnerable to ChatGPT. In the table below, we track transactional query share on the same quarterly and monthly schedule as the section above.
Google vs ChatGPT Market Share Over Time (Transactional Queries Only), 2023-2026
| Period | Google Share | ChatGPT Share |
| Q1 2023 | 94.7% | 0.8% |
| Q2 2023 | 94.4% | 1.0% |
| Q3 2023 | 94.2% | 1.0% |
| Q4 2023 | 93.7% | 1.4% |
| Q1 2024 | 93.4% | 1.9% |
| Q2 2024 | 92.9% | 2.1% |
| Q3 2024 | 92.6% | 2.6% |
| Q4 2024 | 91.8% | 3.3% |
| Q1 2025 | 91.2% | 3.8% |
| Q2 2025 | 91.0% | 4.5% |
| Q3 2025 | 87.7% | 7.9% |
| Q4 2025 | 87.2% | 8.4% |
| January 2026 | 87.1% | 8.5% |
| February 2026 | 86.7% | 8.9% |
| March 2026 | 86.9% | 8.7% |
| April 2026 | 86.6% | 9.0% |
| May 2026 | 86.2% | 9.4% |
| June 2026 | 86.4% | 9.2% |
| July 2026 | 86.1% | 9.7% |
| August 2026 | 85.3% | 10.3% |
| September 2026 | 85.7% | 10.0% |
| October 2026 | 85.4% | 10.2% |
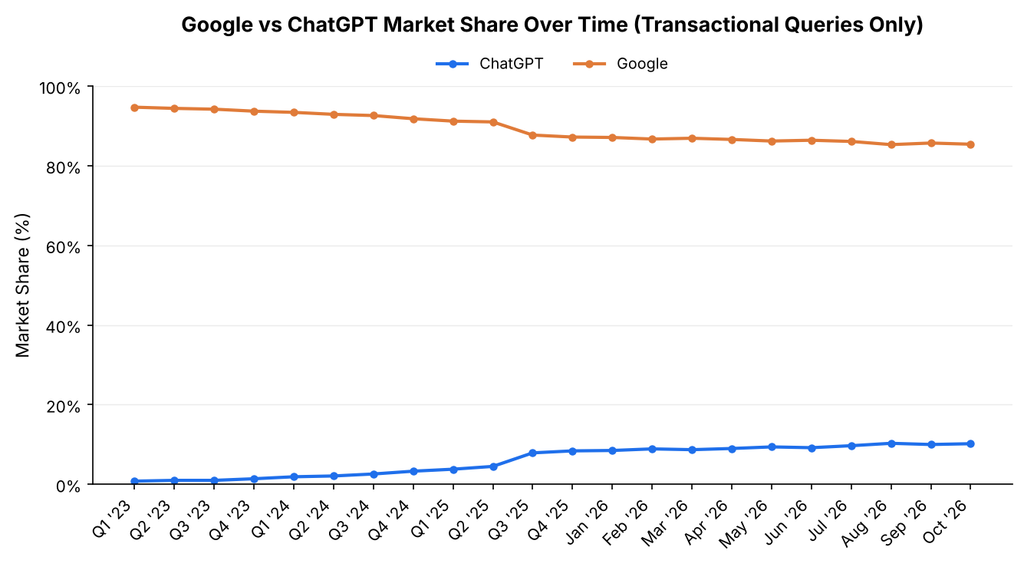
- We found that Google held 85.4% of transactional queries in October 2026, nearly 10 points above its 75.7% share of all queries.
- Our data showed ChatGPT at 10.2% of transactional queries, roughly half its 19.0% share of all queries.
- We suspect users still rely on Google when they have a clear intent to buy, compare products or services, or visit a specific website. Google’s mature search ecosystem, shopping features, local business listings, ads, and direct links make it more equipped for transactional tasks, while most ChatGPT users are researching, brainstorming, and answering complex questions.
Market Share by Device Type
In the table below, we compare Google and ChatGPT usage across platforms, revealing device-based user behavior trends.
Google vs ChatGPT Market Share by Device Type, 2026
| Platform | Desktop Usage Share | Mobile Usage Share |
| Google Search | 35% | 65% |
| ChatGPT | 58% | 42% |
- We found that ChatGPT sees stronger engagement on desktops, with 58% of its usage, suggesting a preference among professionals and researchers. This is consistent with its strength in informational and generative queries, rather than transactional queries where Google dominates.
- Our data showed Google’s mobile-first design holding 65% of its usage on mobile, which solidifies its position among casual and on-the-go users.
- Our researchers expect ChatGPT’s 42% mobile share to keep rising as its app, which crossed 1 billion monthly users in May 2026, takes a larger role in on-the-go queries.
Market Share by Age Group
In the table below, we detail market share trends segmented by user age group.
Google vs ChatGPT Market Share by Age Group, 2026
| Age Group | Google Share | ChatGPT Share |
| 13-24 | 71% | 20% |
| 25-44 | 78% | 15% |
| 45-64 | 86% | 10% |
| 65+ | 89% | 6% |
- Generational habits are shifting: We found that users aged 13-24 give ChatGPT 20% of their queries, more than three times the 6% share among users 65 and older. Younger users appear more willing to replace or supplement traditional search engines with conversational AI.
- Google’s position remains highly resilient: Our data showed Google with at least 71% share in every age group, indicating that conversational AI is complementing traditional search for most users.
- AI adoption will likely broaden over time: As AI tools become more integrated into browsers, operating systems, and workplace software, we expect older age groups to gradually increase their use, narrowing today’s generational gap.
Market Share by User Intent
In the table below, we classify digital queries into primary intent categories, showing how Google and ChatGPT are used differently.
Google vs ChatGPT Market Share by User Intent, 2026
| Intent Category | Google Share | ChatGPT Share |
| Navigational | 93% | 3% |
| Informational | 69% | 25% |
| Transactional | 85% | 10% |
| Generative/Creative | 27% | 66% |
- We found that Google leads in transactional intents with 85% share, which we attribute to (a) rich ecommerce and map results on the B2C side and (b) greater trust in browsing multiple viewpoints and websites over a single synthesized answer in higher-stakes purchasing scenarios.
- Our data showed ChatGPT leading generative/creative queries such as ideation, storytelling, and academic drafting, with 66% share.
- Navigational queries remain Google’s strongest category at 93%, as users still type brand and site names into a search bar to reach a specific destination.
AI Chatbot Competitive Landscape
While Google Search and ChatGPT occupy different market categories, significant competitive shifts are occurring within the AI chatbot market that have direct implications for ChatGPT’s long-term trajectory. In the table below, we compare AI chatbot web traffic share in October 2025 and October 2026, a different metric from the total digital query share in the tables above and from the U.S. monthly active user share in our chatbot research.
AI Chatbot Web Traffic Market Share, October 2025 vs October 2026
| Platform | October 2025 | October 2026 | YoY Change |
| ChatGPT | 74.9% | 55.1% | -19.8 pts |
| Google Gemini | 12.3% | 25.8% | +13.5 pts |
| Claude | 2.3% | 10.3% | +8.0 pts |
- We found that ChatGPT leads but has lost significant ground over the past year. Its 19.8 percentage point year-over-year decline is a significant loss for any platform at its scale, although its share edged up from 54.8% in September 2026 to 55.1% in October. The gap between ChatGPT and Gemini narrowed from 62.6 points in October 2025 to 29.3 points in October 2026.
- Our data showed Gemini as the biggest winner in YoY growth of chatbot web traffic, growing its share from 12.3% to 25.8%, though it eased from 26.2% in September. In August 2026, the Gemini app passed 1 billion monthly active users, making the gap between the two platforms narrower than web traffic share alone suggests. On a U.S. monthly active user basis, our chatbot research puts ChatGPT at 52.3% and Gemini at 26.3% in October 2026.
- Beyond Gemini, Claude (Anthropic) posted the largest proportional gain, growing its web traffic share from 2.3% to 10.3%, up from 9.9% in September. Our tracking puts Claude’s total monthly active users at 312.4 million in October 2026, and Sensor Tower data reported in June 2026 showed year-over-year MAU growth of 640% for Claude and 973% for Meta AI.
Requesting a Copy of This Report
If you’d like to request a PDF copy of this report or learn more about our agency, you can reach out here.