This compendium is intended to serve as an overview of our published reports and statistics on digital marketing, distilling the key insights from each into a single report. We’ve divided this compendium into 3 categories:
- Digital Marketing Statistics — Our reports on digital marketing statistics have covered ROI, conversion rates, average session duration, customer acquisition costs, and cost per lead for each channel and industry in our dataset.
- SEO Statistics — SEO is our agency’s specialty, and as such we’ve had the opportunity to work with clients across over 50 industries in our 12+ years of experience.
- B2B Marketing Statistics — B2B clients make up approximately 75% of our client base, and we’ve published several reports that pertain specifically to B2B businesses.
We link to each report in our sources below, and a full list of all of our reports may be found here.
Digital Marketing Statistics
Notable Digital Marketing Statistics
|
To understand the success of a digital marketing campaign, you first need to understand which KPIs to track. In the below table, we present the most important KPIs for digital marketing campaigns, as well as benchmarks for each.
Top Digital Marketing KPIs
| KPI | Benchmark | |
| 1 | ROI* | SEO: 748% |
| SEM/PPC: 36% | ||
| 2 | Total # of Marketing Qualified Leads | 40% increase YOY |
| 3 | Average Customer Acquisition Cost (CAC) | Organic: $942 |
| Inorganic: $1,907 | ||
| 4 | LTV to CAC Ratio | 4:1 |
| 5 | % Change in Website Traffic | 45% increase YOY |
| 6 | Engagement Rate | B2B: 71% |
| B2C: 65% | ||
| 7 | Average Conversion Rate | 2.2% |
*3-year average
Tracking these 7 KPIs will provide you with insight into your campaigns, as well as how to course-correct should a particular metric be lagging. For more detail, refer to our full report on Digital Marketing KPIs, as well as our report on Digital Marketing Benchmarks by Industry.
Next, we compare the (a) conversion rates, (b) CACs, (c) time to break even, and (d) ROI of the top digital marketing channels. These metrics provide a high-level overview of each channel, and allow your marketing team to better prioritize your per-channel spend.
Top Digital Marketing Channels, Compared
| Channel | B2B Conversion Rate* | B2C Conversion Rate* | B2B CAC | B2C CAC | Time to Break Even | ROI** |
| SEO | 2.6% | 2.1% | $647 | $298 | 9 months | 748% |
| SEM/PPC | 1.5% | 1.2% | $802 | $290 | 4 months | 36% |
| Email Marketing | 2.4% | 2.8% | $510 | $287 | 7 months | 261% |
| Organic Social | 1.7% | 2.4% | $658 | $212 | 5 months | 229% |
| Paid Social | 0.9% | 2.1% | $983 | $230 | 5 months | 192% |
| Webinars | 2.3% | 1.3% | $603 | $251 | 9 months | 430% |
| Online PR | 0.3% | 0.4% | $1,720 | $381 | 8 months | 62% |
*Visitor-to-lead conversion rate **3-year average
The full reports can be found here: Conversion Rate by Channel, CAC by Channel, Digital Marketing ROI Statistics.
SEO Statistics
Notable SEO Statistics
|
As with digital marketing as a whole, measuring the effectiveness of an SEO campaign begins with using the right KPIs. The below table presents the most important SEO KPIs, and benchmarks for each.
Top SEO KPIs
| KPI | Benchmark | |
| ROI | Year 1 | 160% |
| Year 2 | 861% | |
| Year 3 | 1,223% | |
| 3-Year Average | 748% | |
| Bounce Rate | 36% | |
| Average Session Duration | 3:36 | |
| # of Autofill, Transactional Keywords on Page 1 | 91% growth year-over-year | |
| Pages Per Session | 2.2 | |
| Conversion Rate (Visitor-to-Lead) | 2.4% | |
| % Change in Organic Traffic | 47% growth year-over-year | |
For a more in-depth look at SEO KPIs, refer to SEO KPIs: What Success Looks Like. You may also find detailed statistics for your particular industry in our reports on SEO Benchmarks by Industry, and SEO ROI Statistics.
As important as understanding how to measure the success of your SEO campaign is understanding how your Google ranking position affects the likelihood that a searcher will click through to your website. The below graphic presents the average CTR of the top 2 ad positions, and the top 4 organic positions on Google.
CTRs by Ranking Position

In the full report, we also present our data on CTRs for the full first page, including page elements such as snippets, image results, video results, and Google My Business results.
B2B Marketing Statistics
Notable B2B Marketing Statistics
|
The primary focus of most B2B marketing campaigns is lead generation. As such, the KPIs we recommend tracking for B2B campaigns are shown below.
Top B2B Lead Generation KPIs
| KPI | Benchmark |
| ROI | 748% (Thought Leadership SEO) 36% (PPC) |
| Total # of MQLs | +40% YOY |
| Visitor to Lead Conversion Rate | 2.2% |
| Lead to MQL Conversion Rate | 35% |
| Customer Acquisition Cost (CAC) | $942 (Average Organic) |
| LTV to CAC Ratio | 4:1 |
| Website Traffic | +45% YOY |
The full B2B Lead Generation KPIs report expands on each of these. We also published a separate report examining the top KPIs for B2B SEO campaigns.
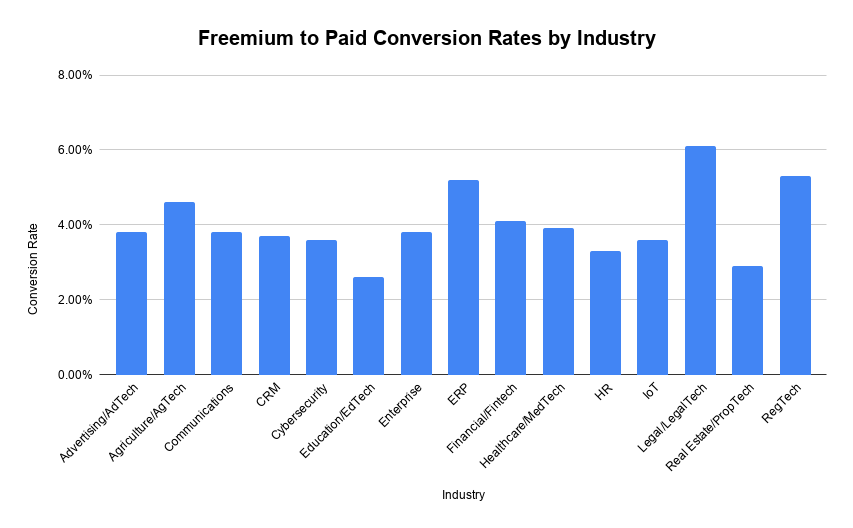
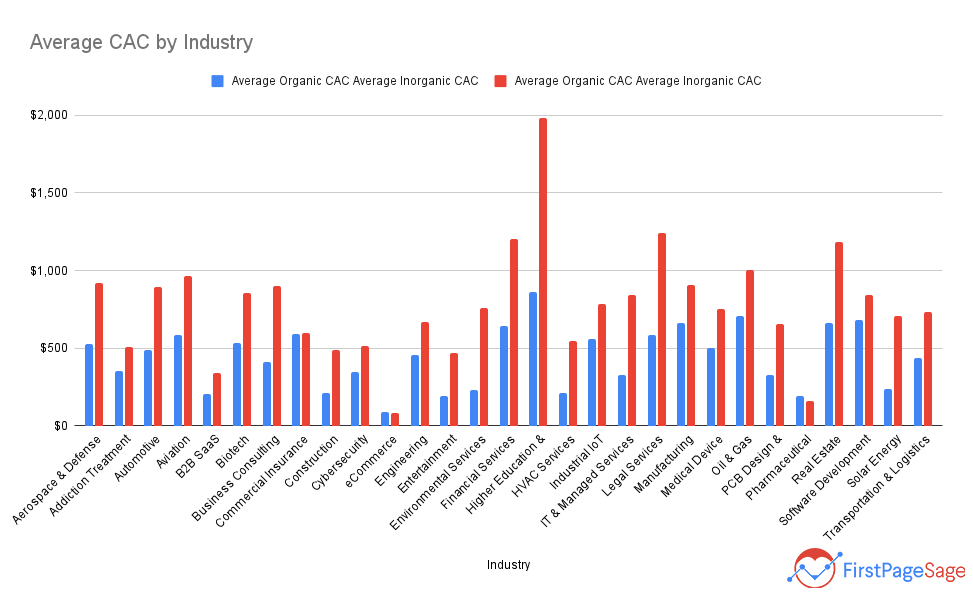
The KPIs above are an average for all industries. For the most relevant data on B2B CACs and conversion rates, refer to the charts below:
Average B2B CACs by Industry, Organic and Inorganic
 B2B Conversion Rates By Industry

Requesting a Copy of this Compendium
You can contact us here if you’d like to request a PDF copy of this compendium, or learn more about our SEO, lead generation, or demand generation services.