Last updated: September 19, 2026
Generative Engine Optimization (GEO) has moved from an experimental marketing tactic to an increasingly important part of organic customer acquisition. It was the fastest-growing marketing channel in 2025 and 2026 through Q2. As AI-powered search becomes a larger part of the research process for buyers, businesses are beginning to evaluate GEO using the same financial metrics they use for SEO, paid search, and other acquisition channels.
Our research team recently conducted a study on GEO customer acquisition costs. Our data was compiled over a 36-month analysis period (October 2023 – September 2026) and encompassed 341 companies implementing GEO strategies across 15 industries. The results are shared below, broken down by industry.
Methodology and Data Sources
This analysis draws from First Page Sage’s proprietary client database spanning 341 B2B and B2C companies that implemented GEO strategies between October 2023 and September 2026. Our methodology tracked customer acquisition costs specifically attributable to GEO projects, including content optimization for AI platforms and reputation management, both essential for building authority with generative engines.
Key limitations: Sample sizes vary by industry (minimum 8 companies per industry). All figures represent organic GEO costs, excluding paid advertising on AI platforms.
GEO Customer Acquisition Cost (CAC) by Industry
| Industry | GEO CAC | Traditional SEO CAC | GEO vs SEO CAC | GEO Lead Quality Score | Avg Time to Convert |
| B2B SaaS | $289 | $205 | +41.0% | 8.3/10 | 45 days |
| Commercial Insurance | $721 | $590 | +22.2% | 8.2/10 | 56 days |
| Construction | $265 | $212 | +25.0% | 7.9/10 | 41 days |
| eCommerce | $363 | $328 | +10.7% | 7.6/10 | 11 days |
| Financial Services | $790 | $644 | +22.7% | 8.9/10 | 44 days |
| Healthcare | $463 | $366 | +26.5% | 8.7/10 | 53 days |
| Higher Education | $1,129 | $862 | +31.0% | 8.5/10 | 61 days |
| Hospitality | $403 | $361 | +11.6% | 7.4/10 | 16 days |
| IT/Managed Services | $407 | $325 | +25.2% | 8.1/10 | 38 days |
| Legal Services | $711 | $584 | +21.7% | 8.6/10 | 39 days |
| Manufacturing | $864 | $662 | +30.5% | 8.4/10 | 47 days |
| Non-Profit | $281 | $256 | +9.8% | 7.7/10 | 22 days |
| Professional Services | $549 | $458 | +19.9% | 8.0/10 | 45 days |
| Real Estate | $804 | $660 | +21.8% | 7.8/10 | 31 days |
| Technology Consulting | $670 | $532 | +25.9% | 8.2/10 | 46 days |
Across all 15 industries, GEO averages approximately $581 per customer acquisition compared with $470 for traditional SEO, which is a 23.6% increase. This means acquiring customers through GEO is more expensive than SEO, but the size of that difference depends heavily on the industry.
In particular, the relatively small difference in GEO vs SEO CAC in eCommerce and hospitality may reflect the shorter conversion paths common in these industries. An AI-generated recommendation can move a consumer from discovery to purchase or booking relatively quickly, compared to an industry like healthcare or higher education that tends to take longer to convert.
Finally, while GEO acquisition costs trend higher across the board than their SEO counterparts, this only tells part of the story. Reuters reports that AI-referred shoppers generate 41% higher revenue per visit than shoppers arriving through traditional channels, indicating that higher acquisition costs may be worth the investment in the long run.
GEO CAC by Company Size and Implementation Model
Company size can impact the economics of GEO. Larger organizations typically have more resources available for content production, technical implementation, and PR, but they also tend to have more complicated approval processes and organizational barriers to publishing content.
Our team segmented the data by company size, average GEO CAC, average monthly GEO investment, CAC Payback period, and lead conversion rate. In addition, they broke down CAC by the strategy used to implement GEO for clients across all industries.
Average GEO CAC by Company Size
| Company Size | Average GEO CAC | Monthly GEO Investment | CAC Payback Period | Lead Conversion Rate |
| Startup (<$1M ARR) | $517 | $3,100 | 3.2 months | 31% |
| Small Business ($1M-$10M) | $494 | $5,550 | 4.1 months | 28% |
| Mid-Market ($10M-$100M) | $643 | $8,900 | 4.8 months | 26% |
| Enterprise (>$100M) | $780 | $14,000 | 5.2 months | 24% |
In general, GEO CAC increases as organizations grow, while lead conversion rates move in the opposite direction. This does not necessarily mean that GEO becomes less effective at larger companies, but a small company can often identify an important AI-search topic, create or revise content, publish it, and monitor the result without going through multiple departments. An enterprise may need input from legal, compliance, product marketing, communications, SEO, IT, and subject-matter experts before making the same change, which leads to more investment and a longer payback period.
Startups and SMBs also benefit from being able to build their AI-search presence without having to unwind years of legacy content. As generative engines evaluate a company’s overall online presence, a smaller organization can sometimes establish a coherent set of authoritative content faster than a large company with thousands of inconsistent pages.
Average GEO CAC by Implementation Model
| Implementation Model | Average CAC | Success Rate | Time to Results |
| Agency-Managed (Premium) | $497 | 91% | 52 days |
| Agency-Managed (Standard) | $686 | 74% | 92 days |
| In-House with Consulting | $701 | 63% | 116 days |
| In-House Only | $947 | 46% | 203 days |
From this data, we can see that the lowest upfront operating cost does not necessarily produce the lowest customer acquisition cost. Agency-managed premium contracts had a lower CAC than every other implementation model, despite presumably requiring greater direct investment. More importantly, they had the highest success rate and the shortest time to results.
The difference between premium agency management and an in-house-only approach is stark, and suggests that GEO has quite a steep learning curve. Yes, businesses working with an agency are paying for content creation, but they are also paying to shorten the process of determining which content, entities, sources, authority signals, and technical improvements help to generate leads from AI sources.
GEO vs Traditional Digital Marketing Channel CAC Comparison
Next, we compared our GEO CAC data against the CACs of other marketing channels. NOTE: The dataset skews 64% B2B; B2C CACs are significantly smaller.
| Marketing Channel | Average CAC | Lead Quality | Conversion Timeline | Long-Term Value |
| Google Ads (PPC) | $781 | 6.8/10 | 23 days | Low |
| LinkedIn Advertising | $722 | 7.5/10 | 32 days | Medium |
| Organic Social | $701 | 6.2/10 | 67 days | Low |
| Email Marketing | $660 | 6.9/10 | 45 days | Medium |
| Meta Advertising | $595 | 5.9/10 | 35 days | Low |
| GEO | $581 | 8.2/10 | 40 days | High |
| Traditional SEO | $470 | 7.8/10 | 84 days | High |
Paid channels still generally produce results faster because they can immediately place a company’s message in front of a defined audience, but the trade-off is that they’re almost always more expensive. On the other hand, GEO’s $581 CAC is higher than traditional SEO, but lower than the benchmarks for all paid B2B acquisition channels.
At the same time, GEO’s 8.2/10 lead-quality score is the highest in the comparison. Taken together, this means that AI search can intercept prospects relatively late in the research process. Someone asking an AI platform to recommend software vendors, attorneys, financial services providers, manufacturers, or other businesses is often expressing substantially more transactional intent than someone conducting a broad informational search.
In addition, a paid advertisement generally produces exposure only while the company continues spending. A successful GEO asset can potentially influence AI-generated recommendations repeatedly after the initial investment, while also contributing to traditional organic search, brand authority, and other marketing channels, hence the high long-term value of a GEO campaign.
GEO Customer Acquisition Trends: Evolution of GEO CAC (2023-2026)
Finally, we analyzed the quarterly CAC of GEO over time, tracking the marketing channel’s effectiveness as techniques have evolved.
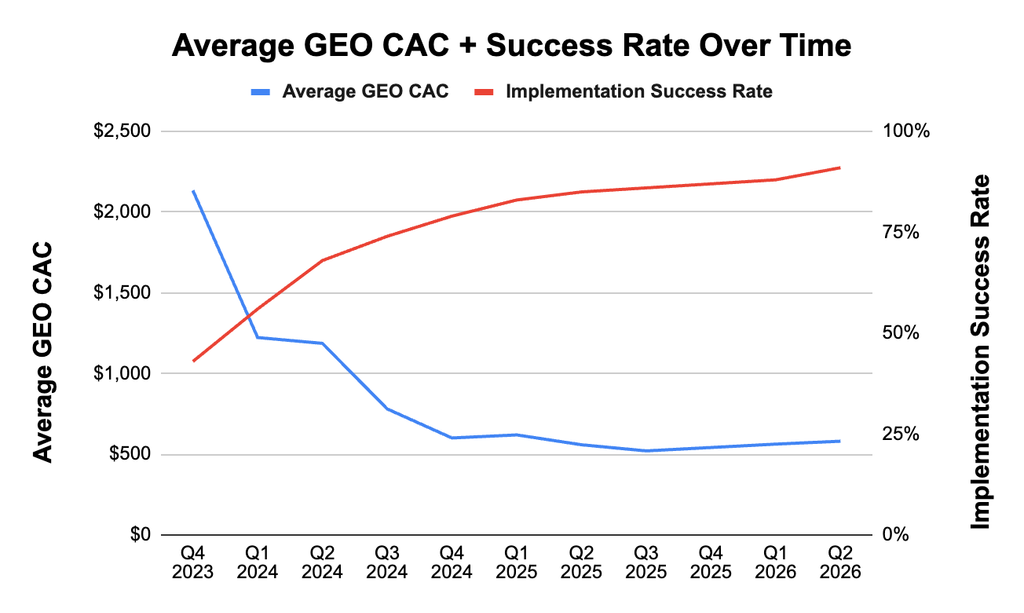
Average CAC fell dramatically from $2,134 in Q4 2023 to $559 in Q2 2025 (a 73.8% decrease) as GEO methodologies became more established. GEO CAC appears to have bottomed out in Q3 2025 and gradually increased thereafter. As more companies adopt GEO and compete for visibility in AI-generated results, achieving and maintaining prominent placement may require more sophisticated optimization, stronger authority signals, and greater investment than it did during GEO’s earlier stages.
At the same time, implementation success continued to improve, reaching 91% in Q2 2026 compared with 85% in Q2 2025 and just 43% in Q4 2023. Together, these trends suggest GEO is becoming more predictable and established, but also more competitive. Businesses are getting better at implementing GEO while facing greater difficulty, and somewhat higher costs, in turning those AI citations into customers.
Conclusions
We’ll continue to analyze these trends, but for now:
- GEO is now a competitive customer acquisition channel. GEO has a higher average CAC than traditional SEO, but it also produced the highest lead-quality score in our channel comparison. Its combination of high-intent leads, relatively low costs compared with paid acquisition, and long-term value makes GEO an increasingly key component of an organic acquisition strategy.
- GEO is becoming more established and competitive. Average CAC fell dramatically as GEO strategies matured, and implementation success increased. This suggests that GEO is becoming more predictable to execute, and generating AI leads is far cheaper than it was two years ago.
- The economics of GEO depend heavily on execution. Companies using premium agency-managed strategies had the lowest CAC, highest success rate, and fastest time to results, while in-house-only programs had the highest CAC, lowest success rate, and longest timeline. For businesses new to GEO, the ability to implement, test, and refine strategies efficiently can have a big impact on acquisition costs.