Between June 5 and September 24, 2026, our research team tracked how political campaigns, party committees, and outside groups are spending money on artificial intelligence in the 2026 midterm cycle. We coded more than 41,000 federal and state disbursement records by vendor and purpose, reviewed platform ad library data, and interviewed 57 campaign consultants and vendors, then applied the same method to the 2022 and 2024 cycles for comparison.
We define campaign AI spending as money paid to AI vendors and tools, the AI-attributable share of production and outreach costs, and the media dollars placed behind ads that were generated or enhanced with AI. The 2026 figures include our projection through Election Day on November 3. In the sections below, we break down that spending by category, timing, spender, race type, and state, and close with a separate question: how much the AI industry itself is spending to shape the outcome.
Political Campaign AI Spending by Category
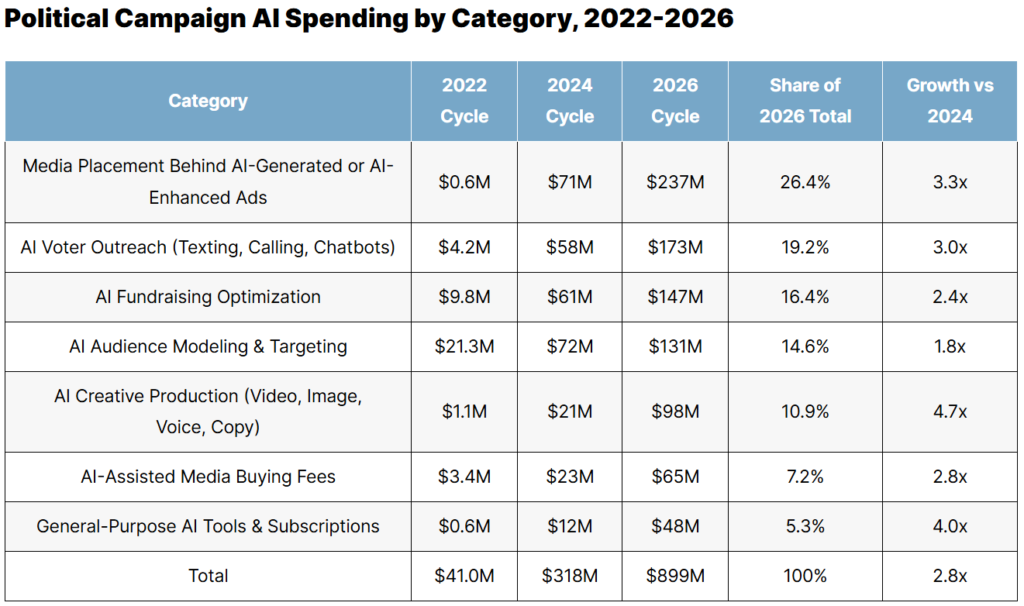
In the table below, we break down campaign AI spending by category across the last three election cycles.
Political Campaign AI Spending by Category, 2022-2026
| Category | 2022 Cycle | 2024 Cycle | 2026 Cycle | Share of 2026 Total | Growth vs 2024 |
| Media Placement Behind AI-Generated or AI-Enhanced Ads | $0.6M | $71M | $237M | 26.4% | 3.3x |
| AI Voter Outreach (Texting, Calling, Chatbots) | $4.2M | $58M | $173M | 19.2% | 3.0x |
| AI Fundraising Optimization | $9.8M | $61M | $147M | 16.4% | 2.4x |
| AI Audience Modeling & Targeting | $21.3M | $72M | $131M | 14.6% | 1.8x |
| AI Creative Production (Video, Image, Voice, Copy) | $1.1M | $21M | $98M | 10.9% | 4.7x |
| AI-Assisted Media Buying Fees | $3.4M | $23M | $65M | 7.2% | 2.8x |
| General-Purpose AI Tools & Subscriptions | $0.6M | $12M | $48M | 5.3% | 4.0x |
| Total | $41.0M | $318M | $899M | 100% | 2.8x |
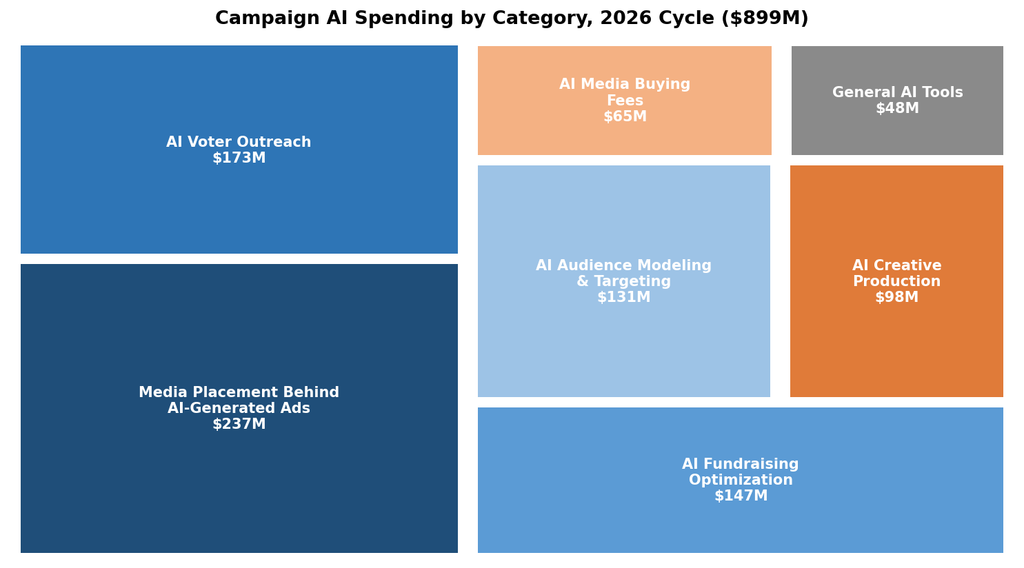
Our team took three findings from this data:
- We found that campaigns, parties, and outside groups will spend an estimated $899 million on AI in the 2026 cycle, 2.8 times the 2024 total and about 22 times the 2022 total. That is equivalent to roughly 8.5% of the $10.6 billion our model projects for all political ad spending this cycle.
- Our data showed creative production growing fastest, at 4.7 times its 2024 level, as campaigns replace studio shoots and voice sessions with generated video and audio.
- Audience modeling grew the slowest, at 1.8 times, because it was the only category with a meaningful AI budget before generative tools arrived. In 2022 it made up more than half of all campaign AI spending.
Cumulative Campaign AI Spending by Election Cycle
In the table below, we align the 2022, 2024, and 2026 cycles by months remaining before Election Day and track cumulative AI spending at each point, so the cycles can be compared at the same stage of the race. (NOTE: 2022’s election cycle occurred just before ChatGPT’s debut, so AI spending was not on modern generative AI.)
Cumulative Campaign AI Spending by Election Cycle, 2022-2026
| Months Before Election Day | 2022 Cycle | 2024 Cycle | 2026 Cycle |
| 18 | $0.2M | $3M | $12M |
| 15 | $0.5M | $8M | $31M |
| 12 | $1.1M | $17M | $64M |
| 9 | $2.4M | $34M | $128M |
| 6 | $5.3M | $71M | $247M |
| 3 | $11.8M | $139M | $431M |
| 1 | $22.6M | $201M | $612M |
| Election Day | $41.0M | $318M | $899M (projected) |
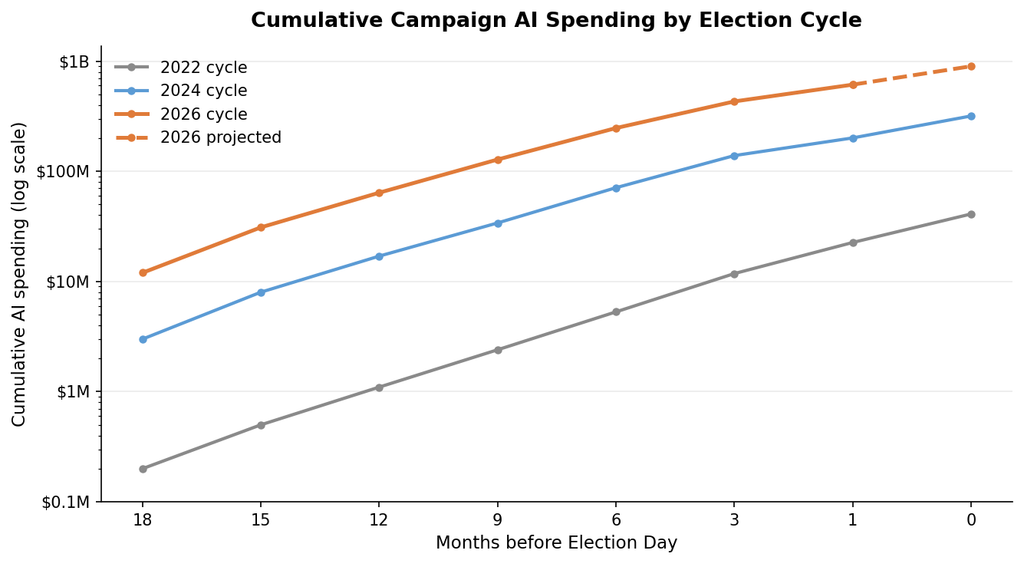
With one month remaining, the 2026 cycle has reached $612 million, nearly double the 2024 cycle’s final total and about three times what 2024 campaigns had spent at the same point. On a log scale, the three cycles run close to parallel, which tells us the ramp within each cycle has stayed consistent: AI spending roughly doubles every three months as Election Day approaches. What has changed is the starting level. Our model projects that 32% of 2026 AI spending will land in the final month, below the 37% share in 2024, because campaigns moved outreach and fundraising automation earlier to reach early voters.
Political Campaign AI Spending by Spender Type
In the table below, we break down 2026 campaign AI spending by who is doing the spending, along with the share of each group’s total budget that goes to AI and the use that draws the most AI dollars.
Political Campaign AI Spending by Spender Type, 2026
| Spender Type | AI Spending | Share of Total AI Spending | AI Share of Total Budget | Largest AI Use |
| Democratic Candidates & Parties | $196M | 21.8% | 7.9% | Fundraising Optimization |
| Republican Candidates & Parties | $214M | 23.8% | 8.6% | Voter Outreach |
| Democratic-Aligned Outside Groups | $178M | 19.8% | 9.4% | Audience Modeling & Targeting |
| Republican-Aligned Outside Groups | $201M | 22.4% | 10.2% | AI-Generated Ad Placement |
| Issue & Nonpartisan Groups | $110M | 12.2% | 6.1% | Creative Production |
| Total | $899M | 100% | 8.5% | AI-Generated Ad Placement |
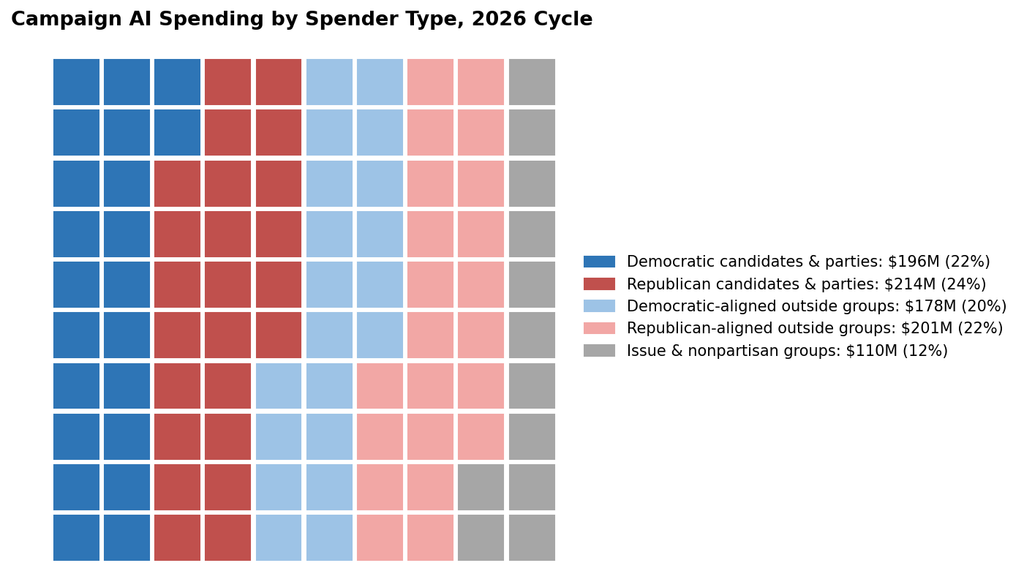
Three patterns stood out to our researchers:
- We found AI spending split close to evenly by party, with Republican-side spenders accounting for $415 million and Democratic-side spenders for $374 million.
- Our data showed outside groups devoting a larger share of their budgets to AI than candidates and parties do, with Republican-aligned groups highest at 10.2%.
- Issue and nonpartisan groups spent the least on AI relative to budget, at 6.1%, and directed most of it to creative production for advocacy and ballot measure campaigns.
Political Campaign AI Spending by Race Type
In the table below, we break down 2026 campaign AI spending by type of race, along with the share of ads in each race type that contained AI-generated or AI-enhanced elements and the share of each race type’s media budget that went to AI.
Political Campaign AI Spending by Race Type, 2026
| Race Type | AI Spending | Share of Total AI Spending | Share of Ads with AI Elements | AI Share of Media Budget |
| U.S. Senate | $286M | 31.8% | 11.4% | 8.1% |
| U.S. House | $305M | 33.9% | 9.2% | 8.9% |
| Governor | $163M | 18.1% | 8.8% | 7.6% |
| State Legislative | $72M | 8.0% | 14.7% | 12.4% |
| Ballot Measures | $49M | 5.5% | 6.3% | 5.2% |
| Local & Judicial | $24M | 2.7% | 16.2% | 13.8% |
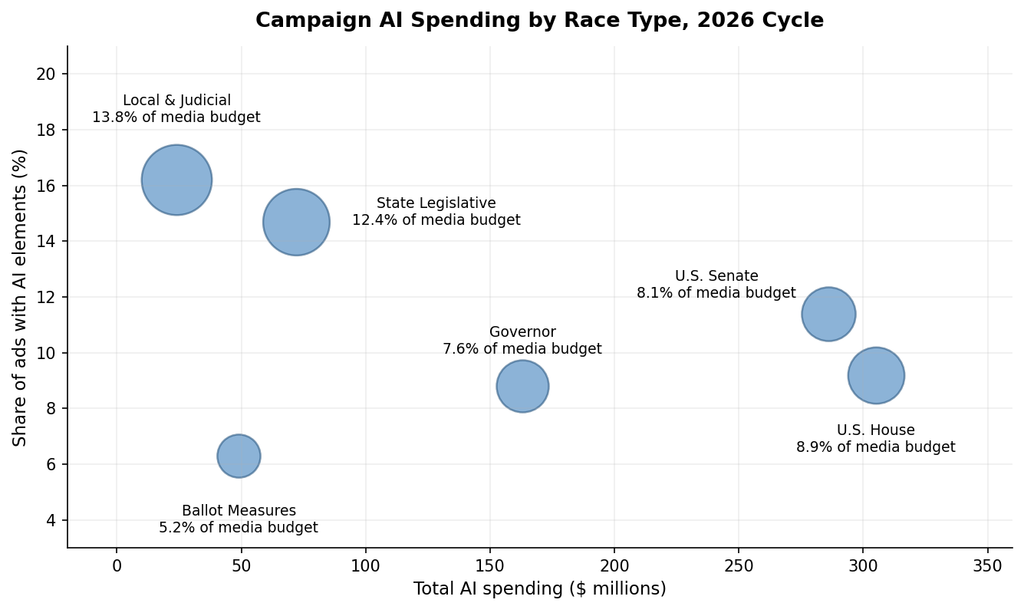
Our team drew three conclusions from the race-level data:
- We found that the smallest races use AI most intensively: 16.2% of local and judicial ads contained AI-generated or AI-enhanced elements, compared with 9.2% of House ads.
- Our data showed federal races accounting for 65.7% of all campaign AI spending, with House races edging out the Senate at $305 million.
- Ballot measure campaigns used AI the least on every measure we tracked, which we attribute to their reliance on a small number of high-production broadcast spots.
Political Campaign AI Spending by State
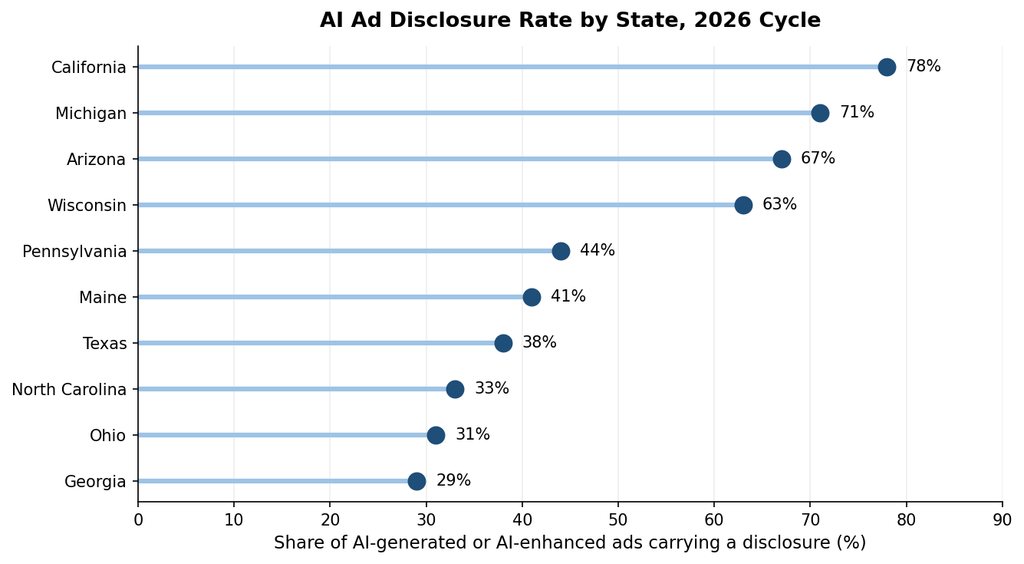
In the table below, we list the 10 states with the highest campaign AI spending in the 2026 cycle, normalized per registered voter, along with the share of AI-generated or AI-enhanced ads in each state that carried a disclosure.
Political Campaign AI Spending by State, 2026
| State | AI Spending | AI Spending per Registered Voter | Share of AI Ads Disclosed |
| Texas | $78.4M | $4.22 | 38% |
| Georgia | $61.2M | $7.46 | 29% |
| Michigan | $54.7M | $6.51 | 71% |
| North Carolina | $52.1M | $6.95 | 33% |
| Pennsylvania | $47.9M | $5.38 | 44% |
| Ohio | $41.3M | $5.16 | 31% |
| Arizona | $36.8M | $8.56 | 67% |
| California | $34.2M | $1.49 | 78% |
| Maine | $27.6M | $25.09 | 41% |
| Wisconsin | $25.9M | $7.19 | 63% |
Our team took three findings from the state data:
- We found that the 10 states in the table account for $460.1 million, or 51.2% of all campaign AI spending this cycle.
- Maine leads in AI spending per registered voter at $25.09, nearly three times any other state in the top 10, because a competitive Senate race is concentrated in a small electorate.
- Our data showed disclosure rates ranging from 29% in Georgia to 78% in California. Across states with AI disclosure laws, 64% of AI ads carried a disclosure, compared with 27% in states without one.
AI Industry Political Spending
Separate from what campaigns spend on AI tools, AI companies, their executives, and affiliated super PACs have become major funders of the 2026 races. In the table below, we break down this money by group type, grouping super PACs and their affiliated nonprofits by stated policy position.
| Group Type | Raised | Spent Through August | Races Entered | Support to Democrats | Support to Republicans |
| Groups Favoring Lighter Federal AI Regulation | $172.6M | $68.3M | 31 | 38% | 62% |
| Groups Favoring Stronger AI Safety Rules | $64.8M | $27.1M | 19 | 57% | 43% |
| Direct Contributions from AI Companies & Executives | $23.4M | $23.4M | 214 | 47% | 53% |
AI Industry Political Spending, 2026
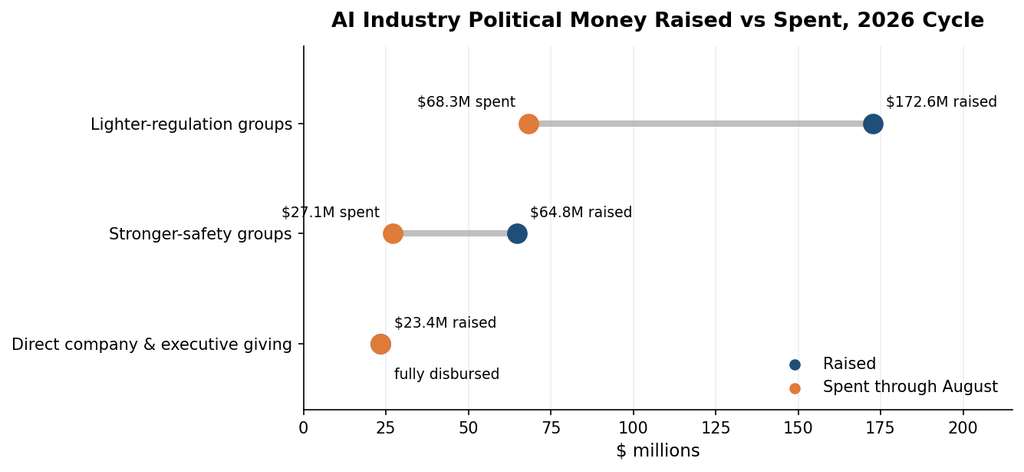
Combined, AI industry political money totals $260.8 million this cycle, of which $118.8 million had been spent by the end of August. Both super PAC networks are holding most of their funds for the general election: groups favoring lighter regulation had spent 40% of what they raised, and groups favoring stronger safety rules had spent 42%. Both support candidates in both parties, in opposite proportions, which reflects a strategy of backing individual lawmakers based on their positions on AI legislation rather than on party. Very little of this money has funded ads about AI itself; most of it pays for ads on health care, immigration, the economy, and candidate biography.
Requesting a Copy of This Report
If you’d like to request a PDF copy of this report or learn more about our agency, you can reach out here.