Last updated: July 7, 2026
Our team compiled data from 16 unique sources to estimate ChatGPT’s usage as of July 2026. Because each source had a different methodology for calculating usage, our model used a weighted average of all sources, with the weights based on the source’s longevity, credibility, and reputed accuracy. Further, we applied our model to the trailing 12 months to create a picture of the last year’s ChatGPT usage trend.
ChatGPT Number of Users: July 2026
The following table shares the number of unique users of ChatGPT as of July 2026. We break out standalone ChatGPT (website + app), Microsoft Copilot (which is powered by ChatGPT) and the combination of both. Afterwards, we share the 12 month trend.
| ChatGPT* *excluding Copilot | Microsoft Copilot | ChatGPT Total | |
| Users | 853 million | 111 million | 901 million |
| Visits | 6.1 billion | 1.3 billion | 6.4 billion |
| AI Search Market Share | 52.1% | 8.4% | 60.5% |
| Estimated Quarterly User Growth | 4% ▲ | 3% ▲ | 4% ▲ |
| 12 Month Trend |  |  |  |
ChatGPT Total Monthly Users: 12 Month Trend (May 2026)
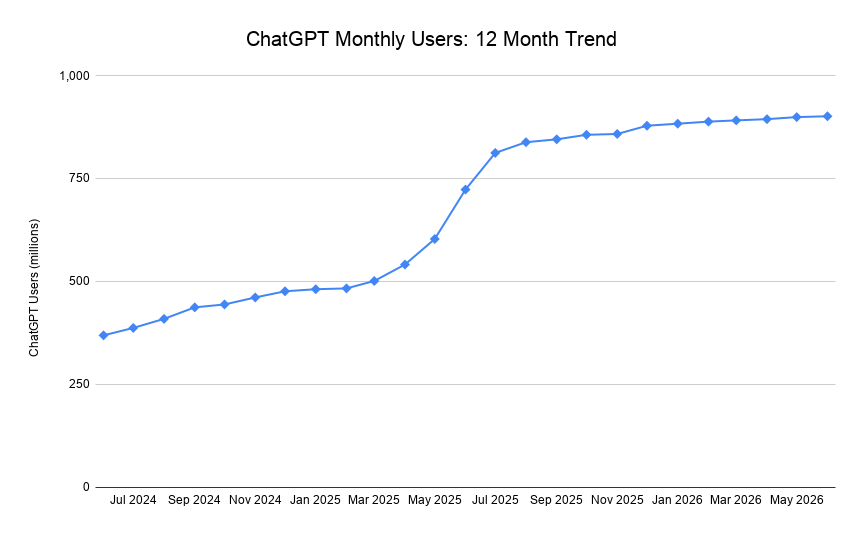
| Jul 2025 | Aug 2025 | Sep 2025 | Oct 2025 | Nov 2025 | Dec 2025 | Jan 2026 | Feb 2026 | Mar 2026 | Apr 2026 | May 2026 | Jun 2026 |
| 812 mil. | 838 mil. | 845 mil. | 856 mil. | 858 mil. | 878 mil. | 883 mil. | 888 mil. | 891 mil. | 894 mil. | 899 mil. | 901 mil. |
ChatGPT Market Share: July 2026
Below you can see the trend of ChatGPT’s market share over the past 12 months. Overall it remains fairly stagnant; while overall usage is growing well, competition from other generative AI chatbots continues to increase. Notably, Google’s recent Gemini update has been very well received and has seen increased usage compared to previous months.
ChatGPT Market Share: 12 Month Trend (July 2026)
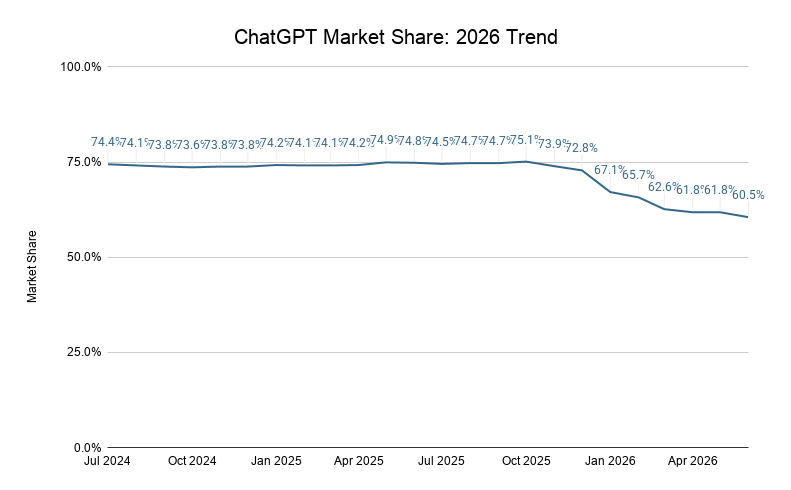
| Jun 2025 | Jul 2025 | Aug 2025 | Sep 2025 | Oct 2025 | Nov 2025 | Dec 2025 | Jan 2026 | Feb 2026 | Mar 2026 | Apr 2026 | May 2026 | Jun 2026 |
| 74.8% | 74.5% | 74.7% | 74.7% | 75.1% | 73.9% | 72.8% | 67.1% | 65.7% | 62.6% | 61.8% | 61.8% | 60.5% |
ChatGPT Competitor Market Share: July 2026
Below you will find the market share trend of ChatGPT’s competitors. ChatGPT remains the market leader by a wide margin even as relative upstarts like Claude rapidly gain in market share.
ChatGPT Competitor Market Share: 12 Month Trend (July 2026)
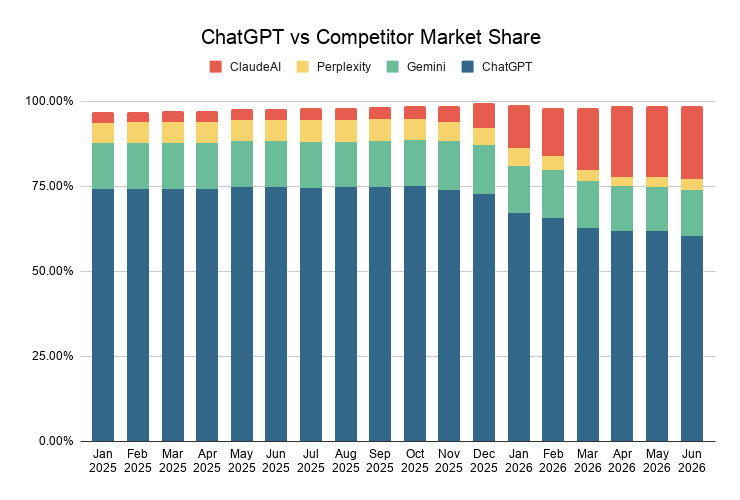
| ChatGPT Comptitor | Jul 2025 | Aug 2025 | Sep 2025 | Oct 2025 | Nov 2025 | Dec 2025 | Jan 2026 | Feb 2025 | Mar 2026 | Apr 2026 | May 2026 | Jun 2026 |
| Google Gemini | 13.5% | 13.4% | 13.5% | 13.4% | 14.4% | 14.3% | 14.0% | 14.1% | 13.8% | 13.2% | 13.1% | 13.3% |
| Perplexity | 6.5% | 6.5% | 6.6% | 6.4% | 5.5% | 5.1% | 5.3% | 4.0% | 3.4% | 2.8% | 2.7% | 3.4% |
| ClaudeAI | 3.5% | 3.4% | 3.6% | 3.8% | 4.7% | 7.2% | 12.5% | 14.3% | 18.1% | 20.9% | 21.1% | 21.5% |
ChatGPT Use Cases: July 2026
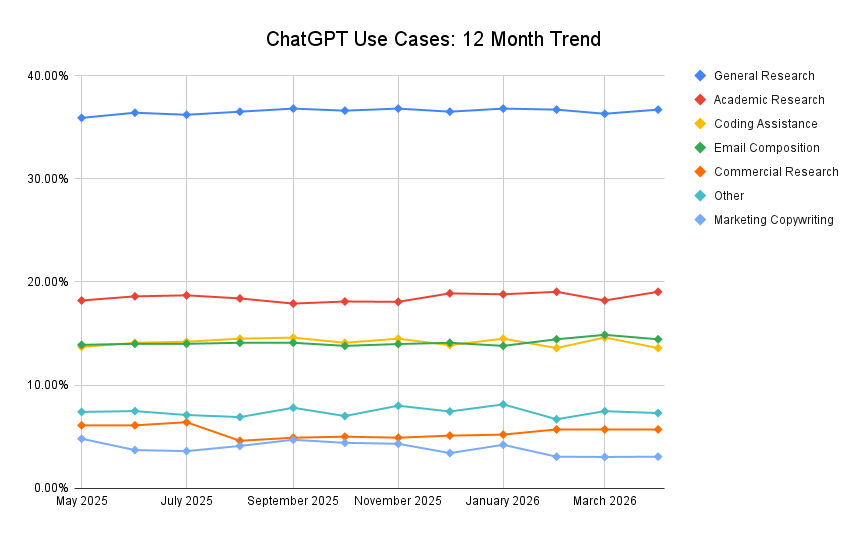
Below we have published the breakdown of how people are using ChatGPT. The largest use case is general research, followed by academic research. There are 26 other cases in the “Other” category.
ChatGPT Use Cases: 12 Month Trend (July 2026)
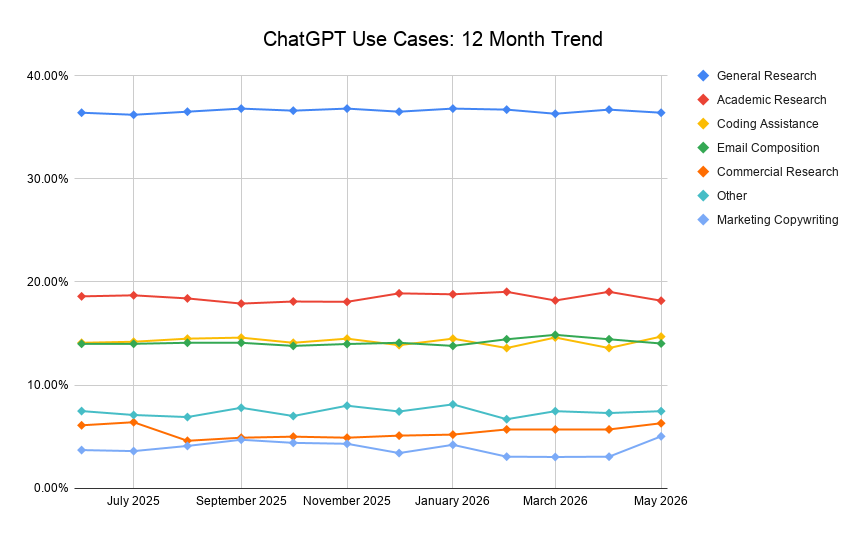
| Use Case | Jun 2025 | Jul 2025 | Aug 2025 | Sep 2025 | Oct 2025 | Nov 2025 | Dec 2025 | Jan 2026 | Feb 2025 | Mar 2026 | Apr 2026 | May 2026 |
| General Research | 36.2% | 36.5% | 36.8% | 36.6% | 36.8% | 36.5% | 36.8% | 36.7% | 36.3% | 36.7% | 36.4% | 36.3% |
| Academic Research | 18.7% | 18.4% | 17.9% | 18.1% | 18.1% | 18.9% | 18.8% | 19.0% | 18.2% | 19.0% | 18.2% | 19.4% |
| Coding Assistance | 14.2% | 14.5% | 14.6% | 14.1% | 14.5% | 13.9% | 14.5% | 13.6% | 14.6% | 13.6% | 14.7% | 13.5% |
| Email Composition | 14.0% | 14.1% | 14.1% | 13.8% | 14.0% | 14.1% | 13.8% | 14.4% | 14.9% | 14.4% | 14.0% | 14.4% |
| Commercial Research | 6.4% | 4.6% | 4.9% | 5.0% | 4.9% | 5.1% | 5.2% | 5.7% | 5.7% | 5.7% | 6.3% | 5.8% |
| Marketing Copywriting | 3.6% | 4.1% | 4.7% | 4.4% | 4.3% | 3.4% | 4.2% | 3.1% | 3.0% | 3.1% | 5.0% | 3.1% |
ChatGPT Retention Rate by Subscription Tier
We looked at a cohort of subscribers from January through December 2025 and estimated subscription retention rate retention based on self-reporting at the 3 month, 6 month, and 1 year marks.
| Subscription Tier | 3 Months | 6 Months | 1 Year |
| ChatGPT Plus | 73% | 64% | 59% |
| ChatGPT Team | 85% | 78% | 68% |
| ChatGPT Enterprise | 95% | 92% | 88% |
ChatGPT Visitor Share by Country: July 2026
The table below lists the top countries in the world by share of ChatGPT visits. The US and India represent the largest visitor bases in the world, followed by Brazil at a distant third.
ChatGPT Visitor Share by Country (July 2026)
| Country | Share Of ChatGPT Visitors |
| United States | 17.1% |
| India | 16.5% |
| Brazil | 5.8% |
| Canada | 5.4% |
| France | 4.3% |
| Mexico | 3.6% |
| United Kingdom | 2.7% |
| Spain | 3.7% |
| Germany | 2.4% |
| Italy | 2.5% |
| Phillipines | 2.5% |
| Australia | 1.8% |
| Colombia | 1.6% |
| Argentina | 1.3% |
| Netherlands | 1.1% |
| South Korea | 1.1% |
ChatGPT Purchasing Trends: July 2026
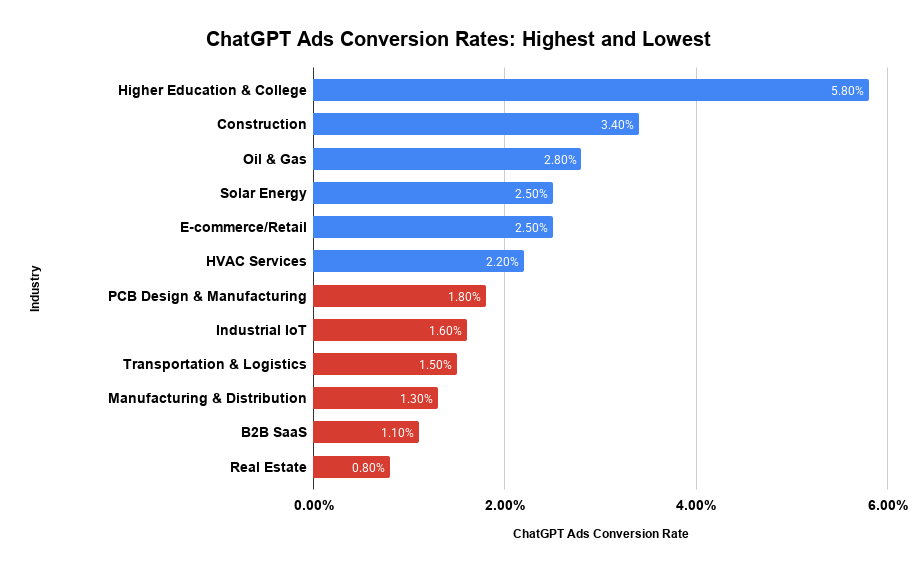
In the table below, we have published the top industries in which customers are using ChatGPT to assist with making purchases. While at most 47% of the members of an industry use ChatGPT in their purchasing journey, that number has increased in each of the last 10 months.
Top Industries Using ChatGPT to Make Purchases (July 2026)
| # | Industry | % of Customers Using ChatGPT in Purchasing Journey | ChatGPT’s Estimated Financial Impact by Industry |
| 1 | Travel & Hospitality | 47% | $1.48 trillion |
| 2 | Retail & CPG | 36% | $1.11 trillion |
| 3 | IT Services | 34% | $936 billion |
| 4 | Lifestyle, Health & Wellness | 32% | $891 billion |
| 5 | Food & Beverage | 32% | $546 billion |
| 6 | Home Services | 31% | $385 billion |
| 7 | Healthcare | 29% | $378 billion |
| 8 | Automotive | 29% | $243 billion |
| 9 | B2B SaaS | 28% | $229 billion |
| 10 | Advertising & Marketing | 27% | $156 billion |
| 11 | Fintech | 25% | $135 billion |
| 12 | Insurance | 23% | $104 billion |
| 13 | Real Estate | 21% | $66 billion |
| 14 | Financial Services | 21% | $21.7 billion |
| 15 | Education | 19% | $12.6 billion |
Requesting a Copy of This Report
If you’d like a pdf copy of this report, you can reach out here.
Related Reading
- Top Generative AI Chatbots by Market Share
- Which Industries Use Generative AI To Make Purchases?
- ChatGPT Optimization: 2026 Guide
- Generative Engine Optimization (GEO): Explanation & Algorithm Breakdown
- Generative Engine Optimization (GEO) Strategy Guide