Last updated November 4, 2026
Between July 2025 and October 2026, our research team conducted a study compiling customer retention data across industries. We aggregated data points from client earnings reports, industry surveys, and platform benchmarks, covering eight types of business.
Customer retention rate is the share of customers at the start of a rolling twelve month period who are still customers at the end of it. Some sources measure retention differently, so we normalized each input to an annual figure. Monthly churn was compounded over 12 months, and where a type had more than one input, we took the simple average. Churn rate is 100% minus retention rate, and average client lifetime is 1 divided by annual churn.
In the sections below, we examine retention by business type, the drivers behind recent changes, and retention by customer size.
Customer Retention Rates by Business Type
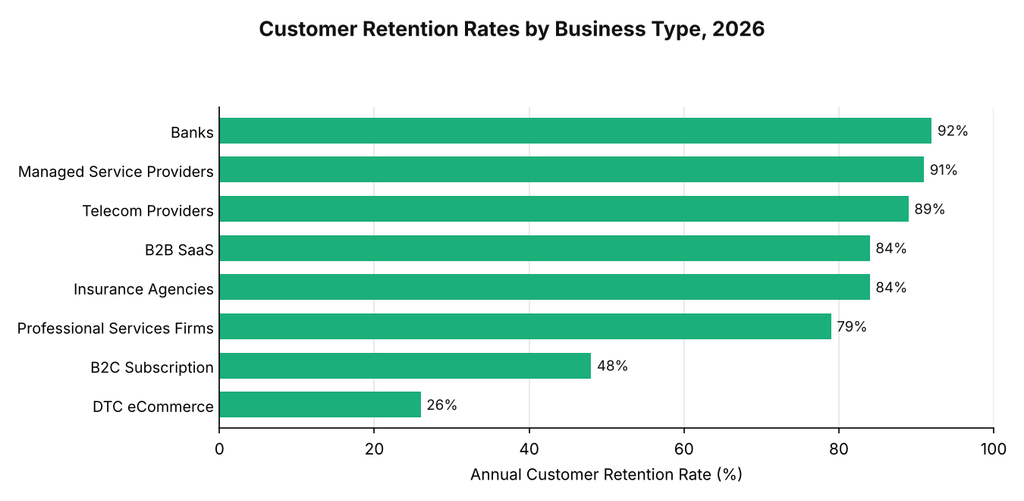
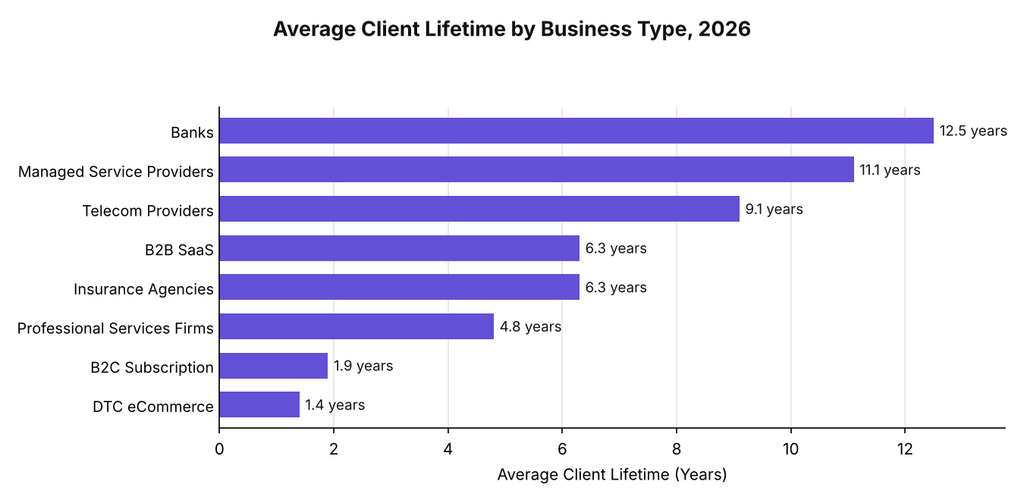
In this table we break down average client lifetime, annual retention rate, and annual churn rate for each of the eight business types, ranked by retention.
Customer Retention Rates by Business Type, 2026
| Business Type | Avg Client Lifetime | Retention Rate | Churn Rate |
| Banks | 12.5 years | 92% | 8% |
| Managed Service Providers | 11.1 years | 91% | 9% |
| Telecom Providers | 9.1 years | 89% | 11% |
| B2B SaaS | 6.3 years | 84% | 16% |
| Insurance Agencies | 6.3 years | 84% | 16% |
| Professional Services Firms | 4.8 years | 79% | 21% |
| B2C Subscription | 1.9 years | 48% | 52% |
| DTC eCommerce | 1.4 years | 26% | 74% |
Our researchers took three main points from this data:
- We found a 66-point gap between banks at 92% and DTC eCommerce at 26%, which implies an average bank relationship nearly nine times the length of the average DTC relationship.
- We suspect structure explains much of the gap. The six business types above 75% tend to rely on contracts, renewals, or accounts that take effort to move, while the two lowest can be left with a cancellation or by not buying again.
- We found that small changes in retention have large effects on implied lifetime near the top of the table. The 8-point gap between banks and B2B SaaS corresponds to a 6.2-year difference.
Drivers of Retention Rate Change
In the table below, we pair each driver we identified with a major change or gap associated with it.
Drivers of Retention Rate Change, 2026
| Driver | Business Type | Result |
| Buyer scrutiny and AI alternatives | B2B SaaS | 88% to 84% |
| Sales-led relationships | B2B SaaS | 88% vs 79% |
| Contract value | B2B SaaS | 91% vs 80% |
| Price increases | Telecom Providers | 0.97% to 1.09% |
| Value-led plans and loyalty programs | Telecom Providers | 0.98% to 0.94% |
| Failed payments | Subscription businesses | 33% and 32% |
| Proactive client outreach | Insurance Agencies | 32% vs 24% |
Two observations stood out to our team:
- We suspect budget pressure and AI alternatives are the largest current drag on B2B SaaS retention. The decline may be tied to longer sales cycles, ROI scrutiny, and buyers weighing AI-native options, and every quartile fell.
- We found that up to 30% of subscription churn comes from failed payments, which suggests a portion of lost customers never chose to leave.
Retention by Company Size
Company size data is most complete for B2B SaaS. In the table below, we use annual contract value as the measure of customer size.
Retention by Company Size, 2026
| Annual Contract Value | Gross Revenue Retention | Gross Revenue Churn | Net Revenue Retention |
| Under $12,000 | 90% | 10% | 98% |
| $12,000 to $25,000 | 91% | 9% | 103% |
| $25,000 to $50,000 | 91% | 9% | 102% |
| $50,000 to $100,000 | 90% | 10% | 104% |
| $100,000 to $250,000 | 91% | 9% | 102% |
| Above $250,000 | 95% | 5% | 106% |
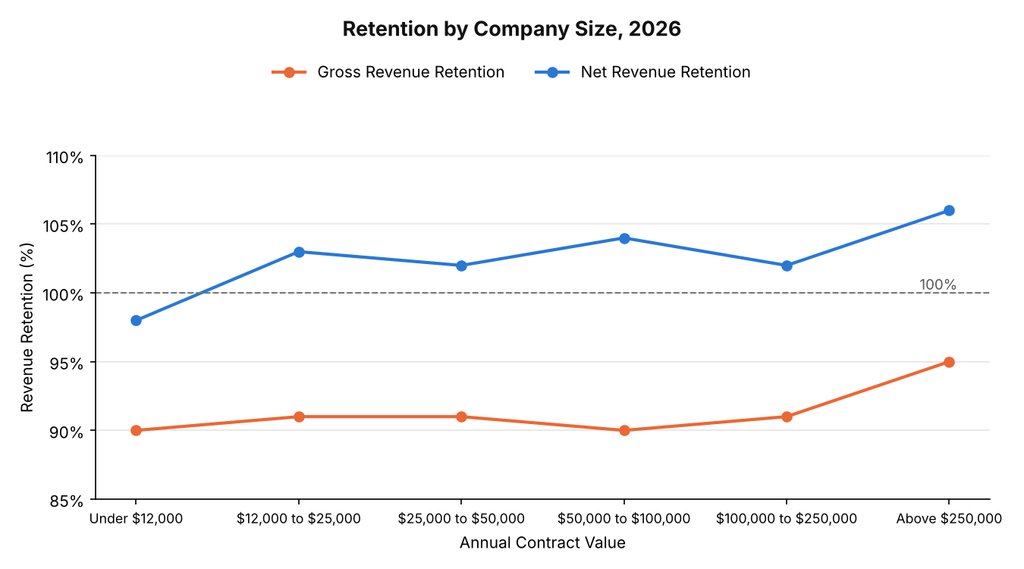
Two findings stood out to our team:
- We found that gross retention holds at 90% to 91% across the first five bands, then rises to 95% above $250,000.
- Our data showed the under $12,000 band as the only one where net retention falls below 100%, so the median company in that band shrinks its existing revenue base.
Requesting a Copy of This Report
If you’d like to request a PDF copy of this report or learn more about our agency, you can reach out here.