From March 9 to September 18, 2026, our research team studied how people use Claude, the AI assistant built by Anthropic, across its consumer apps and its coding agent. We compiled data from 17 sources, including app intelligence panels, web traffic panels, company disclosures, and anonymized analytics from our own client campaigns, then combined them in a weighted model that favors sources with longer track records and documented methodologies.
Claude usage happens on three platforms: the Claude web and desktop app, the Claude mobile app, and Claude Code, the agentic coding tool that has become Anthropic’s fastest-growing product. We report each platform separately, then deduplicate people who use more than one. In the sections below, we break down Claude’s user base, its 12-month growth trend, what people use it for, how well each paid plan retains subscribers, and where its users are located.
Total Claude Usage: September 2026
In the table below, we break down Claude’s user base by platform as of the end of August 2026. The total column counts each person once, regardless of how many of the platforms they use.
Total Claude Usage, September 2026
| Metric | Claude Web & Desktop | Claude Mobile App | Claude Code | Claude Total |
| Monthly Active Users | 176.4 million | 122.8 million | 11.3 million | 271.3 million |
| Weekly Active Users | 92.1 million | 71.6 million | 6.8 million | 148.2 million |
| Monthly Sessions | 1.14 billion | 2.31 billion | 0.41 billion | 3.86 billion |
| Average Session Length | 14.2 minutes | 9.6 minutes | 38.7 minutes | 14.1 minutes |
| Estimated Quarterly User Growth | 19% ▲ | 37% ▲ | 44% ▲ | 26% ▲ |
Our team took three findings from this data:
- We found that Claude reached 271.3 million monthly active users in August 2026, with 148.2 million of them using it at least once a week.
- Our data showed the mobile app generating about twice as many sessions as the web app, though web sessions ran nearly 50% longer on average.
- Claude Code users averaged 38.7 minutes per session, close to three times the platform average, which reflects the long, multi-step nature of agentic coding work.
Monthly Active Claude Users, by Month
In the table below, we track Claude’s total monthly active users across all three platforms over the trailing 12 months, along with the month-over-month change our model recorded.
Monthly Active Claude Users by Month, 2025-2026
| Month | Monthly Active Users | Month-over-Month Change |
| September 2025 | 39.2 million | Baseline |
| October 2025 | 42.8 million | +9.2% |
| November 2025 | 47.5 million | +11.0% |
| December 2025 | 55.1 million | +16.0% |
| January 2026 | 68.9 million | +25.0% |
| February 2026 | 94.3 million | +36.9% |
| March 2026 | 131.6 million | +39.6% |
| April 2026 | 172.4 million | +31.0% |
| May 2026 | 214.8 million | +24.6% |
| June 2026 | 247.1 million | +15.0% |
| July 2026 | 252.6 million | +2.2% |
| August 2026 | 271.3 million | +7.4% |
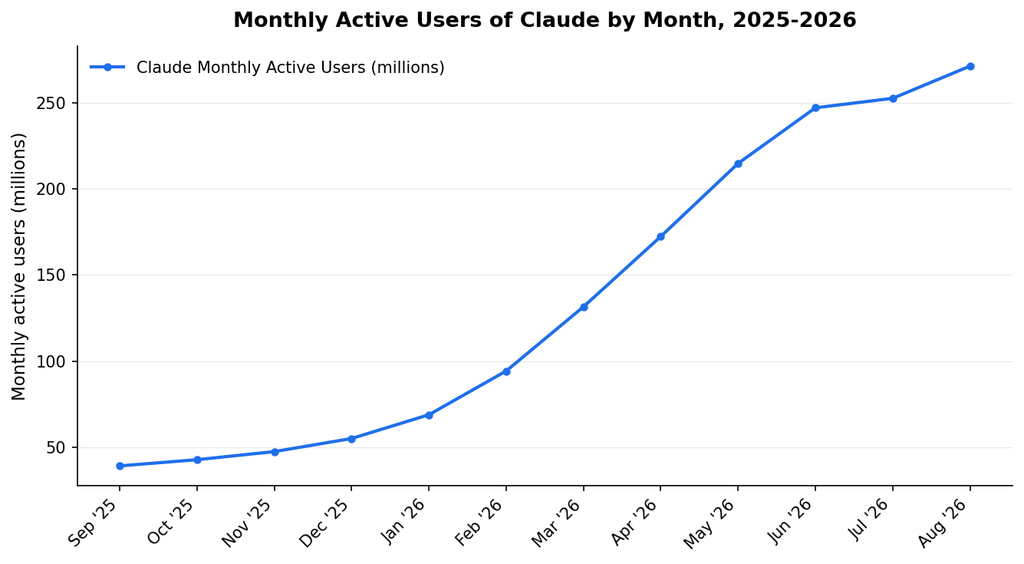
Growth accelerated sharply between January and April 2026, a period that coincided with Anthropic’s first Super Bowl campaign, broad press coverage of Claude Code, and a surge in new mobile installs. Our model shows the curve flattening in July, after access to Claude Fable 5 was suspended from June 12 to July 1 under U.S. export controls, before growth resumed in August. Across the full period, Claude’s monthly user base grew 6.9 times. For a view of how this growth compares with other assistants, see our report on the top generative AI chatbots by market share.
Top Claude Use Cases
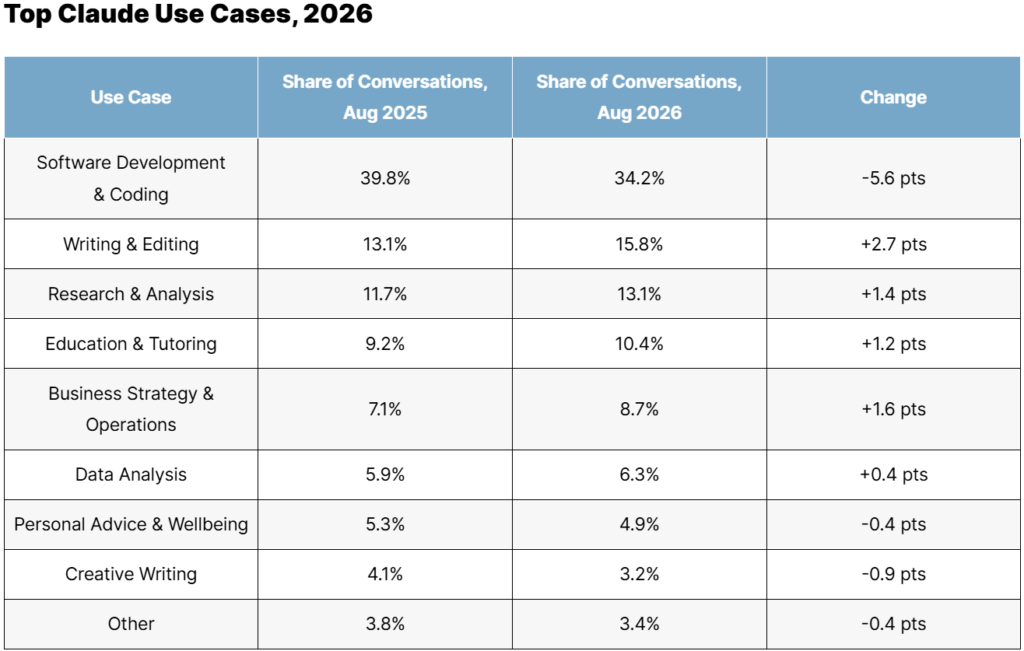
In the table below, we break down the share of Claude conversations by primary use case in August 2025 and August 2026. Our classifier assigned each sampled conversation from the web, desktop, and mobile apps to a single category. Claude Code sessions are excluded from this sample because nearly all of them involve software work.
Top Claude Use Cases, 2026
| Use Case | Share of Conversations, Aug 2025 | Share of Conversations, Aug 2026 | Change |
| Software Development & Coding | 39.8% | 34.2% | -5.6 pts |
| Writing & Editing | 13.1% | 15.8% | +2.7 pts |
| Research & Analysis | 11.7% | 13.1% | +1.4 pts |
| Education & Tutoring | 9.2% | 10.4% | +1.2 pts |
| Business Strategy & Operations | 7.1% | 8.7% | +1.6 pts |
| Data Analysis | 5.9% | 6.3% | +0.4 pts |
| Personal Advice & Wellbeing | 5.3% | 4.9% | -0.4 pts |
| Creative Writing | 4.1% | 3.2% | -0.9 pts |
| Other | 3.8% | 3.4% | -0.4 pts |
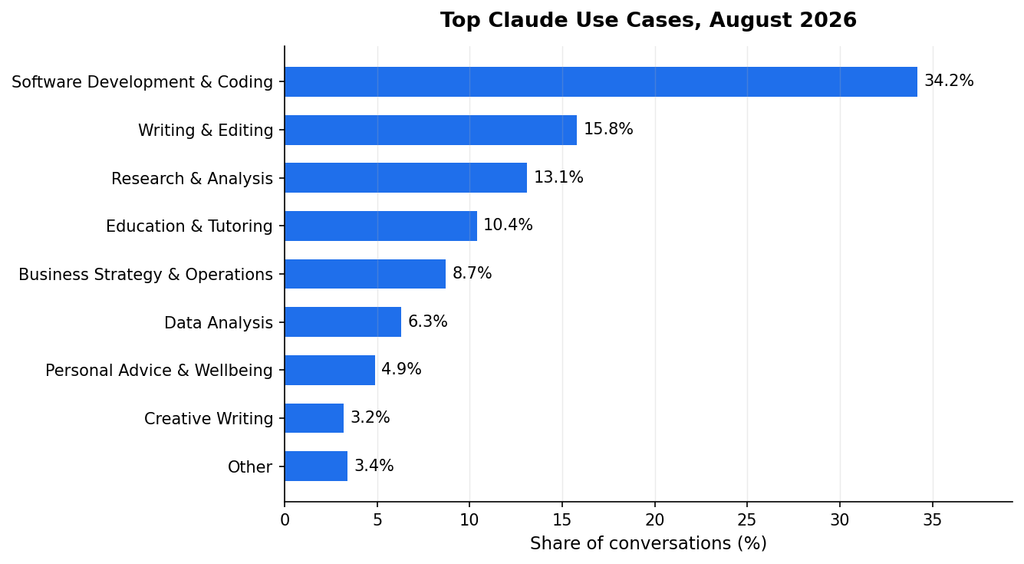
Three patterns stood out to our researchers:
- We found that software development remains Claude’s largest use case at 34.2% of conversations, even with Claude Code sessions excluded from the sample.
- Our data showed coding’s share falling 5.6 points over the year as a broader, less technical audience joined the platform, with writing and editing gaining the most ground at 2.7 points.
- Business strategy and operations rose 1.6 points to 8.7%, consistent with growing seat-based deployments inside companies. The mix differs from ChatGPT’s, where general research leads, as our ChatGPT usage statistics report shows.
Claude Subscriber Retention by Plan
In the table below, we share estimated retention for a cohort of paid subscribers who started between July 2025 and March 2026, measured at the 3-month, 6-month, and 1-year marks. One-year figures are drawn from the earliest subscribers in the cohort.
Claude Subscriber Retention by Plan, 2026
| Plan | 3 Months | 6 Months | 1 Year |
| Claude Pro | 76% | 67% | 61% |
| Claude Max | 84% | 77% | 70% |
| Claude Team | 88% | 81% | 73% |
| Claude Enterprise | 96% | 93% | 89% |
Retention rises with commitment and seat count. Enterprise contracts renew on annual terms and are embedded in company workflows, so most of the movement in that 89% one-year figure reflects accounts that shrank their seat count rather than accounts that left. Among individual plans, Max subscribers retained 9 points better than Pro subscribers at one year. We attribute the gap to usage intensity: in our sample, Max subscribers opened Claude on roughly twice as many days per month as Pro subscribers, and frequency of use was the strongest single predictor of renewal in our model.
Claude Visitor Share by Country
In the table below, we list the 14 countries with the largest share of Claude visitors across web and mobile as of August 2026.
Claude Visitor Share by Country, 2026
| Country | Share of Claude Visitors |
| United States | 21.4% |
| India | 9.7% |
| United Kingdom | 5.2% |
| Brazil | 4.1% |
| Germany | 3.9% |
| Canada | 3.6% |
| France | 3.3% |
| Japan | 3.1% |
| South Korea | 2.8% |
| Australia | 2.6% |
| Spain | 2.2% |
| Netherlands | 1.7% |
| Indonesia | 1.6% |
| Italy | 1.5% |
Our team drew three conclusions from the geographic data:
- We found that the United States accounts for 21.4% of Claude visitors, a larger domestic share than ChatGPT’s, reflecting Claude’s concentration among professional and enterprise users.
- Our data showed India in second place at 9.7%, with a user base weighted more heavily toward developers than any other top-five country.
- The 14 countries in the table account for 66.7% of all Claude visitors, with the remaining third spread across more than 150 countries.
Requesting a Copy of This Report
If you’d like to request a PDF copy of this report or learn more about our agency, you can reach out here.