Between January 6 and August 29, 2026, our research team analyzed marketing spend and acquisition data from 214 companies, 137 of them B2B and 77 B2C, to calculate customer acquisition cost by channel. Where a channel also appears in our existing CAC by channel benchmarks, the figure here is the same figure. What is new in this edition is the set of channels that did not exist or did not carry meaningful volume when we last ran the study, along with a second metric for each channel family that explains why a low CAC does or does not translate into a usable acquisition strategy.
The clearest example is ChatGPT Ads, the self-serve advertising platform OpenAI opened to advertisers on July 22, 2026. Our ChatGPT Ads figures are drawn from seven weeks of live campaign data across 14 accounts, a far shorter window than the rest of the study, so we report an observed range alongside the average and flag the sample size wherever the channel appears.
The sections below rank channels by CAC and pair each ranking with the constraint that actually governs it. All lifetime value figures used to calculate LTV:CAC ratios come from the same dataset, at $32,414 for B2B and $10,089 for B2C.
Lowest CAC Marketing Channels
In the table below, we rank every channel in the study by B2B customer acquisition cost, with the corresponding B2C figure and the B2B LTV:CAC ratio alongside it. Channels marked N/A did not carry enough volume in that segment to report, which is common for account based marketing and SDR programs in B2C and for platform advertising in B2B. Industry-level detail for the B2C side is available in our average CAC by industry report.
The Lowest CAC Marketing Channels, 2026
| Rank | Channel | Channel Family | B2B CAC | B2C CAC | B2B LTV:CAC |
| 1 | ChatGPT Ads | Paid | $468 | $131 | 69.3x |
| 2 | Email Marketing | Organic | $510 | $287 | 63.6x |
| 3 | Public Speaking | Offline | $518 | $472 | 62.6x |
| 4 | GEO | Organic | $584 | $261 | 55.5x |
| 5 | Webinars | Organic | $603 | $251 | 53.8x |
| 6 | Thought Leadership SEO | Organic | $647 | $298 | 50.1x |
| 7 | Social Media Marketing | Organic | $658 | $212 | 49.3x |
| 8 | AI Agent Referral | Emerging | $693 | $246 | 46.8x |
| 9 | Informal Networking | Offline | $711 | $472 | 45.6x |
| 10 | Private Community Sponsorships | Emerging | $766 | $318 | 42.3x |
| 11 | PPC/SEM | Paid | $802 | $290 | 40.4x |
| 12 | Video Marketing | Organic | $815 | $301 | 39.8x |
| 13 | Direct Mail | Offline | $864 | $347 | 37.5x |
| 14 | Reddit and Forum Seeding | Emerging | $894 | $271 | 36.3x |
| 15 | LinkedIn Ads | Paid | $982 | N/A | 33.0x |
| 16 | Meta Ads | Paid | $1,047 | $230 | 31.0x |
| 17 | Creator Newsletter Sponsorships | Emerging | $1,118 | $402 | 29.0x |
| 18 | Content Marketing | Organic | $1,254 | $890 | 25.8x |
| 19 | Affiliate Marketing | Paid | $1,342 | $284 | 24.2x |
| 20 | Industry Trade Shows | Offline | $1,390 | $535 | 23.3x |
| 21 | Podcasts | Organic | $1,472 | $363 | 22.0x |
| 22 | Outdoor Advertising | Offline | $1,690 | $301 | 19.2x |
| 23 | PR | Paid | $1,720 | $379 | 18.8x |
| 24 | Basic SEO | Organic | $1,786 | $1,201 | 18.1x |
| 25 | Field Events and Dinners | Offline | $1,905 | N/A | 17.0x |
| 26 | SDRs | Paid | $1,980 | N/A | 16.4x |
| 27 | TV Ads | Offline | $2,028 | $306 | 16.0x |
| 28 | Programmatic Display | Paid | $2,247 | $431 | 14.4x |
| 29 | Radio Ads | Offline | $2,430 | $375 | 13.3x |
| 30 | Account Based Marketing | Paid | $4,664 | N/A | 7.0x |
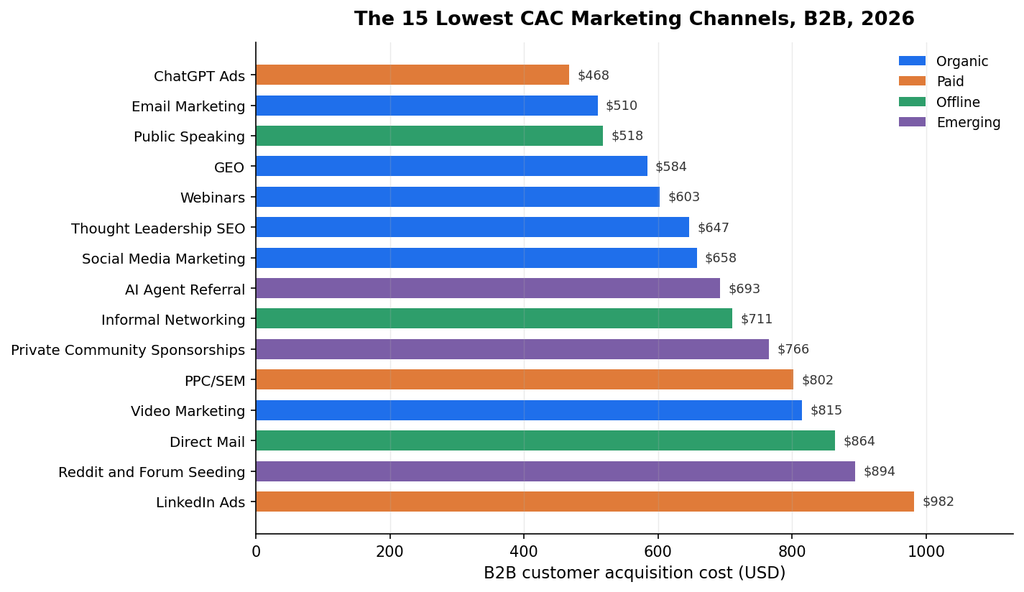
Three findings our researchers drew from the master ranking:
- We found ChatGPT Ads to carry the lowest B2B CAC in the study at $468, roughly 42% below PPC/SEM, on a seven-week sample rather than a full year of data.
- Our data showed the four lowest-CAC channels spread across three different channel families, so channel family on its own is a weak predictor of acquisition efficiency.
- We found account based marketing to be the most expensive channel at $4,664, almost exactly 10 times the cost of the cheapest, and the only channel in the study with an LTV:CAC ratio in single digits.
Lowest CAC Organic Channels
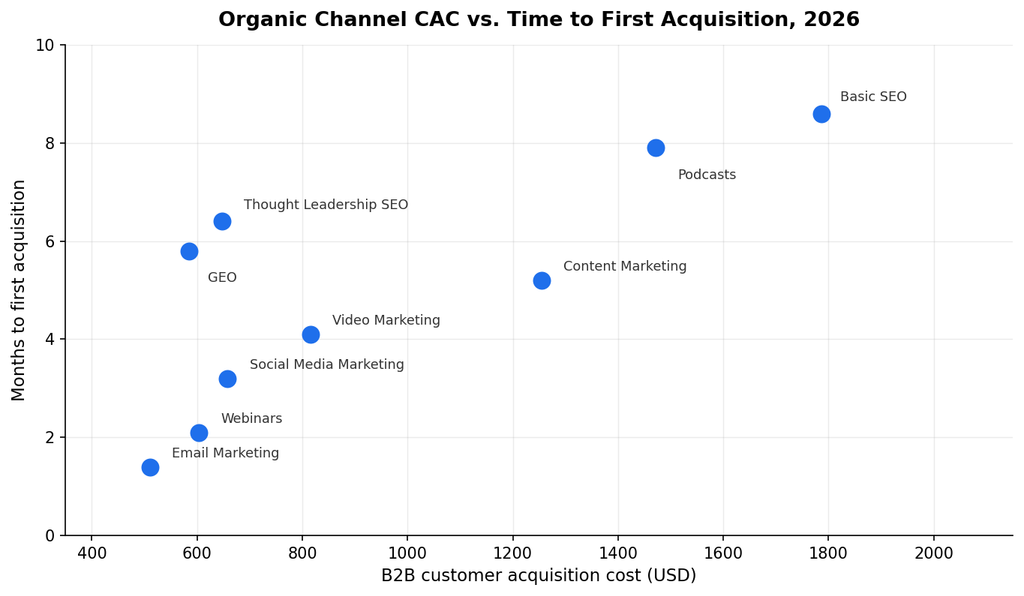
Organic channels are usually chosen on cost and abandoned on time, so we measured both. In the table below, we pair each organic channel’s CAC with the number of months that elapsed between the start of the engagement and the first attributable customer acquisition, averaged across the accounts running that channel.
The Lowest CAC Organic Channels, 2026
| Channel | B2B CAC | B2C CAC | Months to First Acquisition | B2B LTV:CAC |
| Email Marketing | $510 | $287 | 1.4 | 63.6x |
| GEO | $584 | $261 | 5.8 | 55.5x |
| Webinars | $603 | $251 | 2.1 | 53.8x |
| Thought Leadership SEO | $647 | $298 | 6.4 | 50.1x |
| Social Media Marketing | $658 | $212 | 3.2 | 49.3x |
| Video Marketing | $815 | $301 | 4.1 | 39.8x |
| Content Marketing | $1,254 | $890 | 5.2 | 25.8x |
| Podcasts | $1,472 | $363 | 7.9 | 22.0x |
| Basic SEO | $1,786 | $1,201 | 8.6 | 18.1x |
Three findings our researchers drew from the organic data:
- We found email marketing to be both the cheapest organic channel at $510 and the fastest to a first acquisition at 1.4 months, the only channel in the study that led on both measures.
- Our data showed GEO entering the organic rankings at $584, below thought leadership SEO at $647, and with a marginally shorter ramp at 5.8 months against 6.4.
- We found basic SEO to be both the most expensive organic channel and the slowest, at $1,786 and 8.6 months, the pattern we would expect from a channel competing on keyword volume rather than on positioning.
Lowest CAC Paid Channels
Paid channels move faster than organic ones and inflate faster too, so the second measure here is the change in CAC since our 2024 dataset. In the table below, we rank paid channels by B2B CAC and show how far each has moved in two years.
The Lowest CAC Paid Channels, 2026
| Channel | B2B CAC | B2C CAC | Change vs. 2024 | B2B LTV:CAC |
| ChatGPT Ads | $468 | $131 | New channel | 69.3x |
| PPC/SEM | $802 | $290 | +14.1% | 40.4x |
| LinkedIn Ads | $982 | N/A | +31.2% | 33.0x |
| Meta Ads | $1,047 | $230 | +22.6% | 31.0x |
| Affiliate Marketing | $1,342 | $284 | +6.8% | 24.2x |
| PR | $1,720 | $379 | +9.4% | 18.8x |
| SDRs | $1,980 | N/A | +18.7% | 16.4x |
| Programmatic Display | $2,247 | $431 | +27.3% | 14.4x |
| Account Based Marketing | $4,664 | N/A | +11.5% | 7.0x |
Every established paid channel in our dataset became more expensive between 2024 and 2026, in a band running from 6.8% to 31.2%. The one channel that broke the pattern did so by not existing in 2024. ChatGPT Ads opened to self-serve advertisers on July 22, 2026, initially in seven markets, and the early auction was thin enough to produce acquisition costs well below the established search and social platforms. That condition is temporary by construction, so we tracked it weekly rather than reporting a single figure.
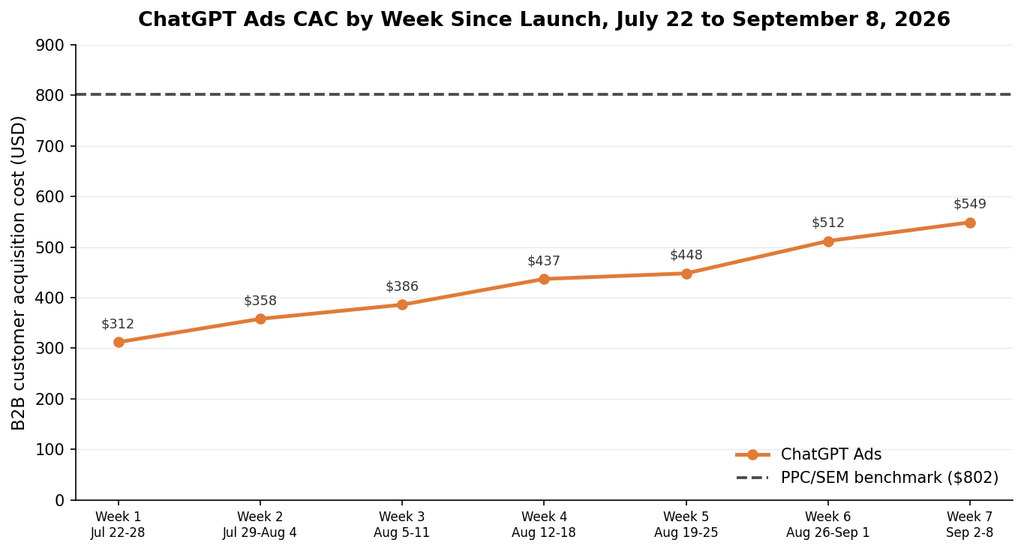
In the table below, we break out ChatGPT Ads CAC for each of the first seven weeks the platform was live, alongside an index of weekly spend across the 14 accounts in the sample. Because spend concentrated in the later, more expensive weeks, the spend-weighted average of $468 sits above the simple average of the seven weekly figures.
The ChatGPT Ads CAC by Week, July 22 to September 8, 2026
| Week | Dates | B2B CAC | Weekly Spend Index (Week 1 = 100) |
| Week 1 | July 22 to 28 | $312 | 100 |
| Week 2 | July 29 to August 4 | $358 | 168 |
| Week 3 | August 5 to 11 | $386 | 241 |
| Week 4 | August 12 to 18 | $437 | 337 |
| Week 5 | August 19 to 25 | $448 | 418 |
| Week 6 | August 26 to September 1 | $512 | 522 |
| Week 7 | September 2 to 8 | $549 | 611 |
Three findings our researchers drew from the paid data:
- We found ChatGPT Ads CAC rose 76% across its first seven weeks, from $312 to $549, as auction density increased and the initial advertiser cohort expanded.
- Our data showed week seven CAC at $549, still 32% below the PPC/SEM benchmark of $802. Extrapolating the current rate of increase puts the two channels at parity before the end of 2026, which is the reason we would treat present ChatGPT Ads economics as a testing window rather than a planning assumption.
- We found LinkedIn Ads to be the fastest-inflating established paid channel at 31.2% above its 2024 CAC, against 14.1% for PPC/SEM and 6.8% for affiliate marketing.
Lowest CAC Offline Channels
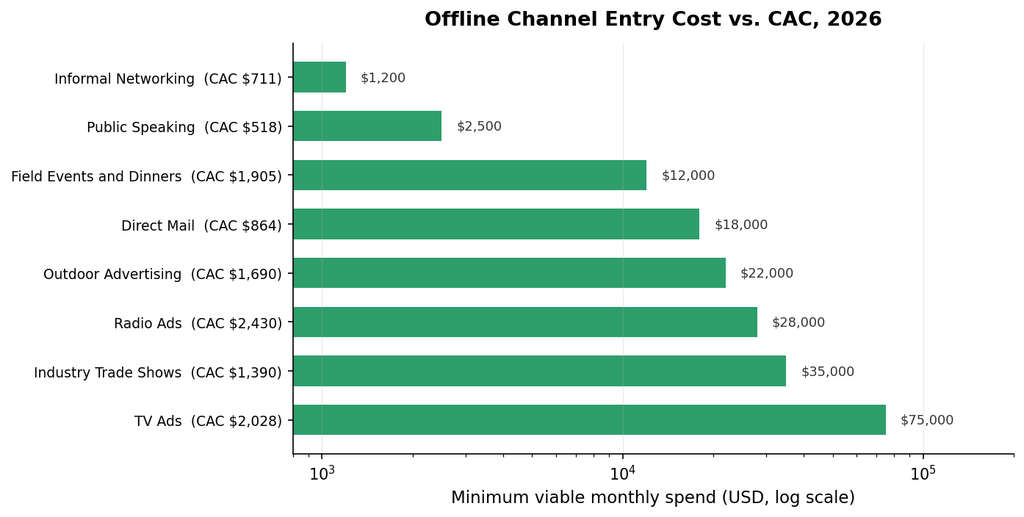
Offline channels are constrained less by unit cost than by the size of the commitment required to run them at all. In the table below, we pair each offline channel’s CAC with the minimum monthly spend at which we observed it producing measurable acquisitions, below which the channel either cannot be bought or cannot be evaluated.
The Lowest CAC Offline Channels, 2026
| Channel | B2B CAC | B2C CAC | Minimum Viable Monthly Spend |
| Public Speaking | $518 | $472 | $2,500 |
| Informal Networking | $711 | $472 | $1,200 |
| Direct Mail | $864 | $347 | $18,000 |
| Industry Trade Shows | $1,390 | $535 | $35,000 |
| Outdoor Advertising | $1,690 | $301 | $22,000 |
| Field Events and Dinners | $1,905 | N/A | $12,000 |
| TV Ads | $2,028 | $306 | $75,000 |
| Radio Ads | $2,430 | $375 | $28,000 |
Three findings our researchers drew from the offline data:
- We found no meaningful relationship between offline CAC and entry cost. Direct mail ranks third on CAC and carries the fourth-highest monthly minimum at $18,000.
- Our data showed public speaking and informal networking to be the only two offline channels a company can test for under $3,000 a month, and both rank in the top three on CAC.
- We found the gap between the cheapest and most expensive entry point to be 62 times, from $1,200 a month for informal networking to $75,000 for television, a spread far wider than the 4.7 times spread in CAC across the same channels.
Lowest Cost Emerging Marketing Channels
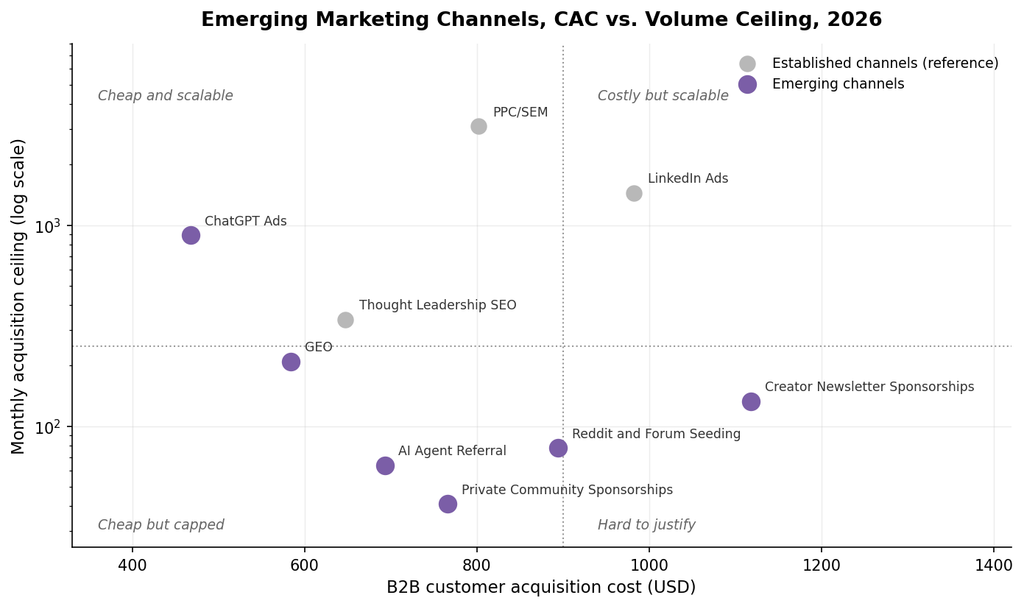
Emerging channels are cheap and small, and the second fact matters as much as the first. In the table below, we pair each channel’s CAC with the highest monthly acquisition volume any account in our sample reached on it, which is the practical ceiling on what the channel can contribute. Sample sizes here are smaller than elsewhere in the study, so we report observed ranges alongside averages. AI agent referral traffic, meaning acquisitions originating from autonomous agents acting on a buyer’s behalf, is measured for the first time this year and is covered further in our agentic AI research.
The Lowest Cost Emerging Marketing Channels, 2026
| Channel | B2B CAC | Observed CAC Range | Monthly Acquisition Ceiling | Accounts in Sample |
| ChatGPT Ads | $468 | $312 to $549 | 890 | 14 |
| GEO | $584 | $498 to $694 | 210 | 47 |
| AI Agent Referral | $693 | $540 to $912 | 64 | 22 |
| Private Community Sponsorships | $766 | $602 to $1,015 | 41 | 19 |
| Reddit and Forum Seeding | $894 | $671 to $1,244 | 78 | 26 |
| Creator Newsletter Sponsorships | $1,118 | $846 to $1,502 | 133 | 31 |
Three findings our researchers drew from the emerging channel data:
- We found ChatGPT Ads to be the only emerging channel with a monthly acquisition ceiling above 500, at roughly 890 for a mid-market B2B advertiser, which is what separates a channel from an experiment.
- Our data showed five of six emerging channels coming in under $900 CAC, and four of those five capping out below 250 acquisitions a month.
- We found sample sizes ranging from 14 to 47 accounts, which is why this section reports observed ranges rather than the point estimates we use elsewhere in the study.
Requesting a Copy of This Report
If you would like a PDF copy of this report, or to learn more about our agency, you can reach out here.