Between January and June of 2026, our research team studied how AI now resides inside the content-creation process across business, personal communication, and social media. We compiled the dataset from a survey of 912 marketing and communications teams, a nationally representative panel of 2,047 U.S. adults, and platform-level sampling of roughly 1.2 million public social posts, then normalized the results so figures are comparable across platforms and company sizes.
For this report, we define AI-generated content as any text, caption, or article where a generative model produced the first draft or a substantial portion of the published wording, whether or not a human later edited it. We separate that from fully human-written content and, where it is useful, break out the degree of human editing applied after the model’s draft.
AI writing tools reached default-utility status faster than most communication technologies before them, and the question our clients ask has shifted from whether to use AI to how much editing published AI content actually needs. This report extends our ongoing research into how generative AI is reshaping content and search. In the sections below, we break the data into three areas: business, personal communication, and social media.
Business AI Content Creation Statistics
For the business findings, we surveyed 912 marketing and communications teams, spanning small businesses, midsize companies, and enterprises, about how they use AI to create content.
Companies Using AI to Create Content, by Business Size
In the table below, we break down the share of companies using AI in their content production, segmented by business size.
The Share of Companies Using AI to Create Content by Business Size, 2026
| Business Size | Share Using AI for Content |
| Small Business | 84% |
| Midsize Business | 78% |
| Enterprise | 62% |
- We found adoption runs highest among small businesses, at 84%, where lean teams lean on AI to cover content work they cannot staff for.
- Adoption declines as company size rises, falling to 62% at the enterprise level, where established content teams, brand governance, and approval processes slow blanket AI use.
- The gap between small and midsize businesses, at 6 points, was narrower than the gap between midsize and enterprise, at 16 points, suggesting the sharpest drop-off comes as organizations scale into formal review structures.
Business AI Adoption Over Time
The snapshot above is the end point of a fast three-year climb. In the table and chart below, we track the share of each business size using AI to create content from 2023 through 2026.
The Share of Businesses Using AI to Create Content Over Time, 2023 to 2026
| Business Size | 2023 | 2024 | 2025 | 2026 |
| Small Business | 38% | 57% | 73% | 84% |
| Midsize Business | 45% | 58% | 69% | 78% |
| Enterprise | 34% | 45% | 55% | 62% |
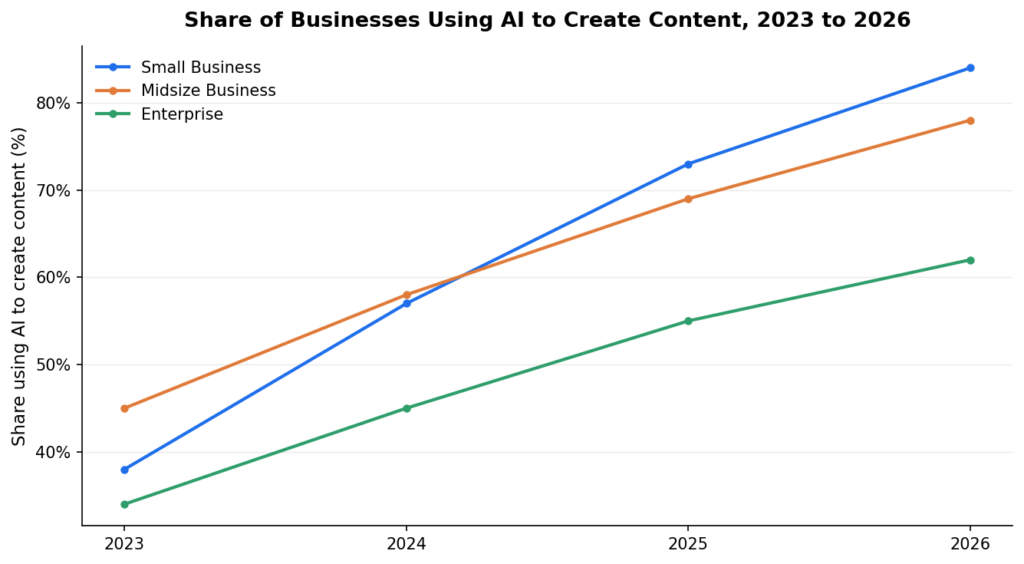
Small businesses started slower than midsize companies in 2023 but overtook them by 2024 and pulled ahead through 2026. The crossover reflects how quickly lean teams adopted AI once capable writing tools became widely available. Enterprises trailed for the entire period, gaining ground steadily but held back by procurement cycles and approval structures that slow organization-wide rollout.
Cost Per Article, Before vs After AI
In the table below, we compare the average fully loaded cost to produce a standard published article before and after AI adoption, by company size.
The Average Cost Per Article Before and After AI by Business Size, 2022 vs 2026
| Business Size | 2022 (Pre-AI) | 2026 (Post-AI) | Cost Reduction |
| Small Business | $365 | $95 | 74% |
| Midsize Business | $540 | $150 | 72% |
| Enterprise | $720 | $220 | 69% |
These figures represent fully loaded cost, including writer time, editing, and project management, normalized to a 1,000-word article. The reduction is real but not total: larger organizations retain more of their pre-AI cost because compliance review, brand governance, and subject-matter validation do not compress the way drafting does.
Lower cost has not translated into higher quality. In our review, the quality floor rose, since AI drafts rarely carry misspellings or poor grammar, while average quality slipped slightly. We attribute the decline to outsourced thinking, as writers increasingly hand the model the reasoning and structure of a piece rather than only its mechanics.
Editing Time Per AI-Generated Piece, by Business Size
In the table below, we break down the average time a team spends editing a single piece of AI-generated content before publishing, by company size.
The Average Editing Time Per AI-Generated Piece by Business Size, 2026
| Business Size | Average Editing Time Per Piece |
| Small Business | 4.8 minutes |
| Midsize Business | 11.2 minutes |
| Enterprise | 24.7 minutes |
- We found editing time climbs sharply with company size, the inverse of what a pure efficiency story would predict.
- Enterprises spent more than five times as long per piece as small businesses, which we tie to layered review and legal or regulatory checks.
- Shorter editing windows at small businesses reflect leaner approval chains rather than lower standards, based on our follow-up interviews.
AI Editing Intensity Across Marketing Teams
In the table below, we break down how much editing marketing teams apply to AI drafts, using four tiers we defined by review time.
The Distribution of AI Editing Intensity Across Marketing Teams, 2026
| Editing Tier | Share of Marketing Teams |
| Direct Publish (no human edits) | 9% |
| Light Pass (under 5 minutes) | 35% |
| Standard Review (5 to 20 minutes) | 41% |
| Deep Revision (20 minutes or more) | 15% |
- We found the largest group, at 41%, applies a standard review of 5 to 20 minutes, which has become the default editing posture.
- Just under one in ten teams publishes AI content with no human editing at all, a practice concentrated in high-volume, low-stakes formats.
- About one in seven teams still invests 20 minutes or more per piece, typically where accuracy or brand voice carries commercial weight.
Website Composition, AI-Generated vs Human-Written
In the table below, we break down what share of a company’s entire website is at least partially AI-generated versus fully human-written, by company size.
The Share of Website Content That Is AI-Generated vs Human-Written by Business Size, 2026
| Business Size | At Least Partially AI-Generated | Fully Human-Written |
| Small Business | 71% | 29% |
| Midsize Business | 64% | 36% |
| Enterprise | 65% | 35% |
Website-level AI share does not move cleanly with company size. Small businesses lead at 71%, since a small site is dominated by a handful of recently produced, AI-touched pages. Midsize companies sit lowest at 64%, old enough to carry a base of legacy human-written pages but not yet producing at the volume that would refresh them. Enterprises tick back up to 65%, where large, continuously updated content operations generate enough new AI-assisted pages to outpace their deep legacy archives.
Most Popular AI Platforms for Content Creation
In the table below, we break down which AI platforms companies rely on most for content creation, by company size. We limited this analysis to the four leading generative AI platforms that accounted for the vast majority of usage in our sample.
The Most Popular AI Platforms for Content Creation by Business Size, 2026
| AI Platform | Small Business | Midsize Business | Enterprise |
| ChatGPT | 55% | 31% | 28% |
| Claude | 22% | 42% | 21% |
| Gemini | 16% | 20% | 44% |
| Grok | 7% | 7% | 7% |
- ChatGPT led among small businesses at 55%, where teams tend to reach for the most recognized name rather than track which model writes best, though Claude has climbed to a clear second at 22%.
- Claude was the top choice at midsize companies by a wide margin, at 42%. This matches a broader pattern in our data: buyers who compare tools on writing quality, without enterprise procurement constraints, trust Claude most.
- Gemini led enterprises by a wide margin at 44%, which we attribute less to preference than to entrenched vendor policies and existing Google agreements that govern which tools enterprise staff are permitted to use.
AI Platform Popularity Over Time
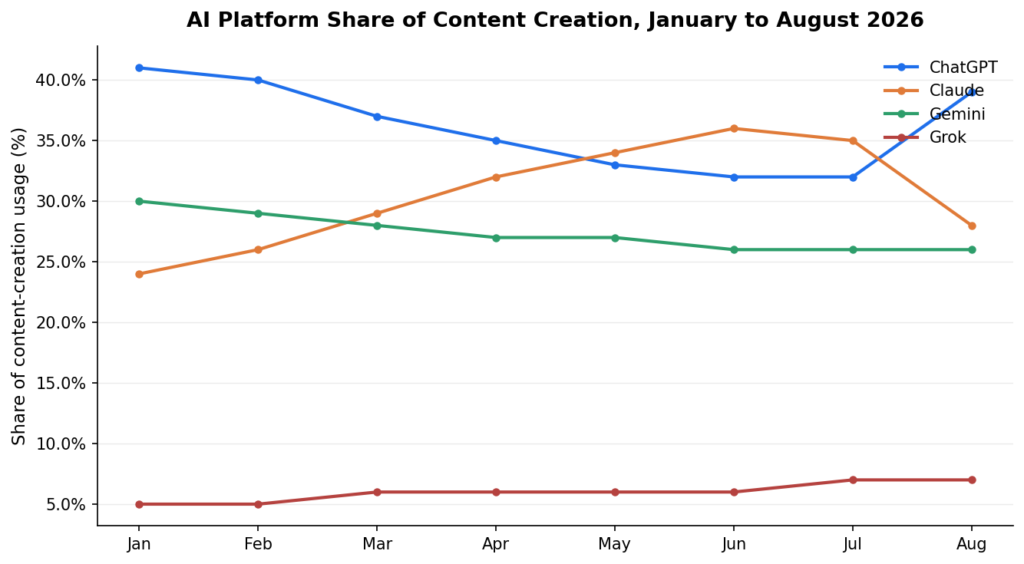
The shares above are an August 2026 snapshot of a fast-moving market. In the table and chart below, we track each platform’s blended share of content-creation usage month by month across 2026.
The AI Platform Share of Content Creation Over Time, January to August 2026
| AI Platform | Jan | Feb | Mar | Apr | May | Jun | Jul | Aug |
| ChatGPT | 41% | 40% | 37% | 35% | 33% | 32% | 32% | 39% |
| Claude | 24% | 26% | 29% | 32% | 34% | 36% | 35% | 28% |
| Gemini | 30% | 29% | 28% | 27% | 27% | 26% | 26% | 26% |
| Grok | 5% | 5% | 6% | 6% | 6% | 6% | 7% | 7% |
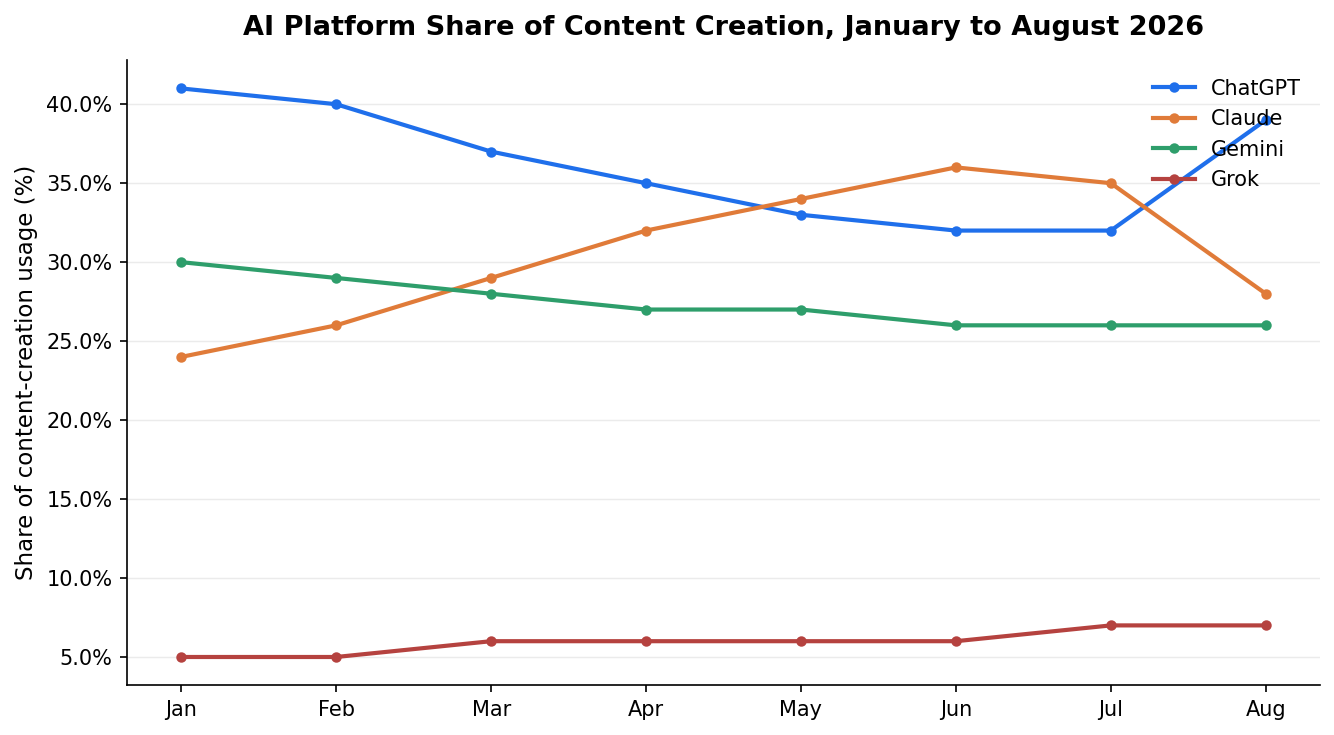
The monthly view shows a genuine race for the top. Claude climbed steadily through the first half of 2026 and passed ChatGPT in the late spring, peaking in June and July. In August its share fell back sharply as ChatGPT regained the lead, a swing large enough that a single-month reading can misrepresent the trend. Gemini drifted down gently across the year, from 30% to 26%, while Grok held the bottom position throughout but gained a little ground, from 5% to 7%.
Estimated Time Savings Per Published Piece
In the table below, we break down the estimated time saved per published piece when AI is involved versus a fully human workflow, by company size.
The Estimated Time Savings Per Published Piece by Business Size, 2026
| Business Size | Time Saved (%) | Hours Saved Per Piece |
| Small Business | 62% | 3.4 hours |
| Midsize Business | 66% | 4.1 hours |
| Enterprise | 58% | 3.8 hours |
Savings peak at midsize companies on both measures: they save 66% of production time and 4.1 hours per piece, more than either smaller or larger firms. Small businesses save a large fraction of an already light process, so the absolute hours come out lower. Enterprises run the longest pieces but return part of their potential savings to layered review and approvals, the same overhead reflected in their editing times above, which holds both their percentage and their hours below midsize.
AI-Generated Content in Top Google Results
In the table below, we break down what share of content ranking in the top Google results is AI-generated, separated by how much human editing the content received.
The AI-Generation Level of Content Ranking in Top Google Results, 2026
| Level of AI Generation | Share of Top-Ranking Content |
| Entirely AI, minimal to no human editing | 0.4% |
| Partially AI, 5+ minutes of human editing per piece | 58% |
| Fully human-generated | 41.6% |
- We found content published with no meaningful human editing is almost entirely absent from top results, at under half a percent.
- The majority of top-ranking content, 58%, is AI-assisted but human-edited, which is now the dominant profile of a page that ranks.
- Fully human-written content still holds a substantial 42%, but the data points to human editing, not human drafting, as the ranking-relevant signal.
Business Reaction to Detected AI-Generated Content
In the table below, we break down how businesspeople react when they detect that content sent to them was AI-generated.
The Business Reaction to Detected AI-Generated Content, 2026
| Reaction | Share of Businesses |
| Slightly positive | 4% |
| Slightly negative | 50% |
| Moderately negative | 33% |
| Very negative (refuse communication or transaction) | 13% |
- We found reactions skew negative overall, but the largest single response, at 50%, was only slightly negative, closer to a mild discount than a rejection.
- About one in eight businesses reacted very negatively, to the point of declining to continue the communication or transaction.
- Only a small minority, 4%, viewed detected AI use slightly positively, generally reading it as a signal of responsiveness or efficiency.
Personal AI Content Creation Statistics
For the personal findings, we surveyed a nationally representative panel of 2,047 U.S. adults about how they use AI to create content in their own lives.
U.S. Adults Using AI to Communicate, by Age
Here, using AI to create content for others means drafting or generating the wording of a message a person then sends, most often an email, a direct message on social media, or a text on a service such as WhatsApp or Telegram. In the table below, we break down the share of U.S. adults who do this, segmented by age group.
The Share of U.S. Adults Using AI to Create Content for Communication by Age, 2026
| Age Group | Share Using AI to Communicate |
| 18 to 29 | 68% |
| 30 to 44 | 57% |
| 45 to 60 | 39% |
| Over 60 | 21% |
| All U.S. adults | 46% |
- We found 46% of U.S. adults now use AI to help write something they send to another person, from emails to messages to posts.
- Usage is steeply age-graded, with adults under 30 more than three times as likely to use AI for communication as those over 60.
- The sharpest drop sits between the 30 to 44 and 45 to 60 groups, a larger gap than any other adjacent pair.
Top Use Cases for Personal AI Content Creation
In the table below, we break down the most common personal use cases among adults who use AI to create content.
The Top Use Cases for Personal AI Content Creation, 2026
| Use Case | Share of AI-Using Adults |
| Resumes and cover letters | 74% |
| Professional emails and messages | 58% |
| Social media posts and captions | 44% |
| Customer service messages and complaints | 31% |
| Personal notes, cards, and letters | 27% |
| Online dating profiles and messages | 22% |
| Reviews and feedback | 19% |
- We found resumes and cover letters the single most common personal use case, at 74%, reflecting how readily people accept AI help on high-stakes, one-time documents.
- Everyday communication follows, with professional emails at 58% and social media posts at 44% the next most common uses.
- Intimate formats, including personal notes and dating messages, sat lowest, suggesting people still hesitate to outsource their most personal writing.
Personal Reaction to Detected AI-Generated Content
In the table below, we break down how individuals react when they detect that a personal message they received was AI-generated.
The Personal Reaction to Detected AI-Generated Content, 2026
| Reaction | Share of Individuals |
| Slightly positive | 3% |
| Slightly negative | 39% |
| Moderately negative | 39% |
| Very negative (refuse communication or transaction) | 19% |
Individuals reacted more harshly to AI in personal settings than businesspeople did in professional ones. The moderately negative and very negative tiers together reached 58% among individuals versus 46% among businesspeople, and only 3% of individuals viewed detected AI use positively. Both patterns are consistent with an expectation that personal communication carries a signal of genuine effort that AI is seen to undercut.
Social Media AI Content Creation Statistics
For the social media findings, we sampled and classified roughly 1.2 million public posts across the platforms studied to estimate how much of their content is AI-generated.
AI-Generated Share of Content by Platform
In the table below, we break down the share of publicly posted content on each major platform that our sampling flagged as at least partially AI-generated in 2026.
The AI-Generated Share of Social Media Content by Platform, 2026
| Platform | AI-Generated Share of Content |
| 54% | |
| X (formerly Twitter) | 41% |
| 38% | |
| 34% | |
| 29% | |
| YouTube | 26% |
| TikTok | 23% |
| 17% |
- We found the highest AI penetration on LinkedIn, where more than half of sampled posts showed model-generated phrasing, consistent with its professional, text-heavy format.
- Platforms built around original imagery and video, such as Instagram and TikTok, showed the lowest text-AI share, since much of their content is not primarily written.
- Reddit was the clearest low-end outlier, which we attribute to community moderation and a culture that penalizes content read as machine-written.
AI Content Share Over Time
The snapshot above reflects a steep climb. In the table and chart below, we track the AI-generated share of content on five platforms from 2021 through 2026.
The AI-Generated Share of Social Media Content Over Time, 2021 to 2026
| Platform | 2021 | 2022 | 2023 | 2024 | 2025 | 2026 |
| 7% | 13% | 24% | 33% | 46% | 54% | |
| X (formerly Twitter) | 5% | 9% | 18% | 26% | 35% | 41% |
| 6% | 10% | 16% | 25% | 32% | 38% | |
| 4% | 7% | 13% | 18% | 24% | 29% | |
| TikTok | 2% | 6% | 11% | 15% | 19% | 23% |
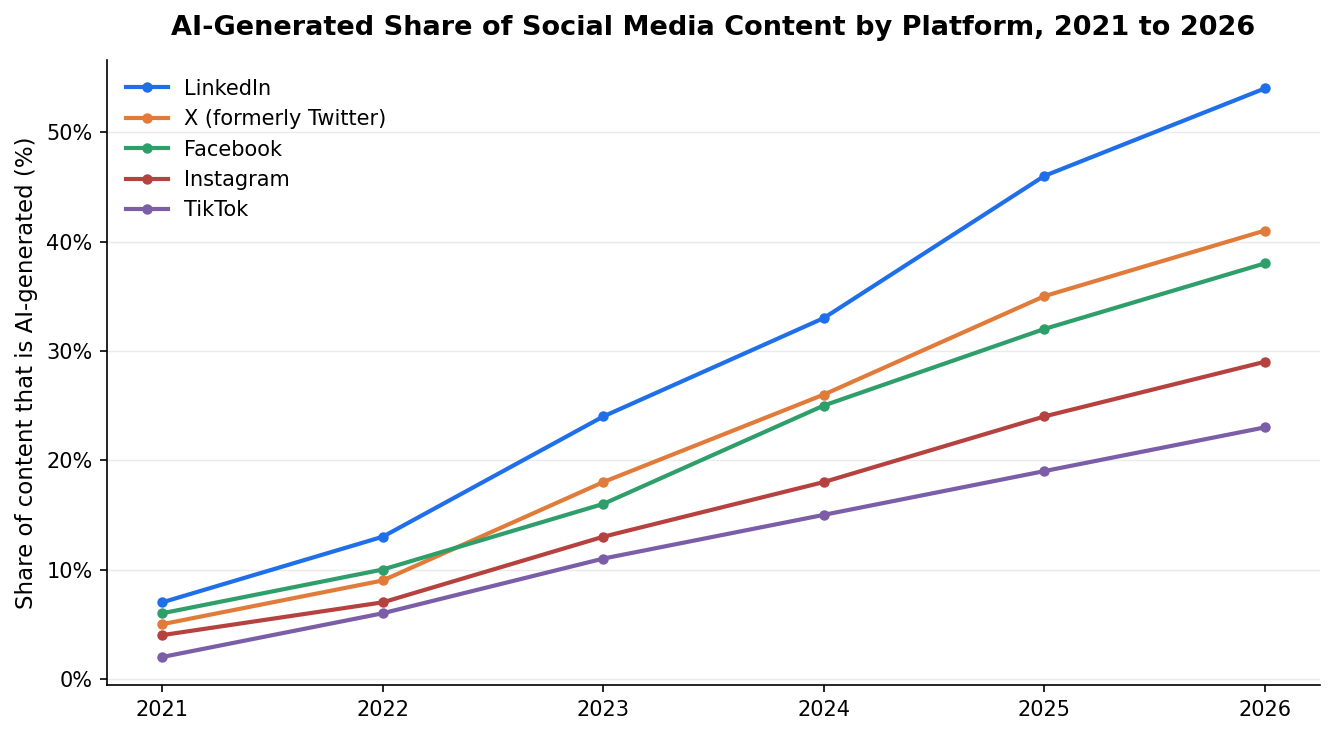
The trajectories are not uniform. LinkedIn and X pulled away from the pack after 2022, coinciding with the mainstream release of general-purpose writing assistants, while Instagram and TikTok grew more slowly off a smaller base. We modeled each platform’s year-over-year change independently rather than fitting a single curve, which is why the lines cross: X overtook Facebook in 2023 as its text-post volume shifted toward AI drafting, and the two moved in near-parallel afterward.
Requesting a Copy of This Report
If you’d like to request a PDF copy of this report or learn more about how our agency approaches content and search strategy, you can reach out here.