Between May 4 and August 21, 2026, our research team ran a standardized battery of 14 production tasks across 11 commercial language models, logging every billed token along the way. That included the tokens most cost estimates leave out: invisible reasoning tokens, cache reads and writes, system prompts re-sent on every turn, and the tokens spent on generations that were retried or discarded.
We started the study because published price sheets were not predicting our clients’ invoices. Price per token says nothing about how many tokens a model needs to finish a job, and tokenizer efficiency, output verbosity, reasoning overhead, and retry rates vary widely from one provider to the next. Those differences compound into the figure that appears on a bill. A model listed at $1.00 per million input tokens can cost more in production than one listed at $2.00.
The sections below present list prices alongside what we measured models actually cost per completed task, per 1,000 words of publishable content, and per month at realistic workload volumes. Model selection reflects the deployment mix we observe across client accounts, which tracks closely with the broader generative AI chatbot landscape.
AI Token Usage Cost by Model
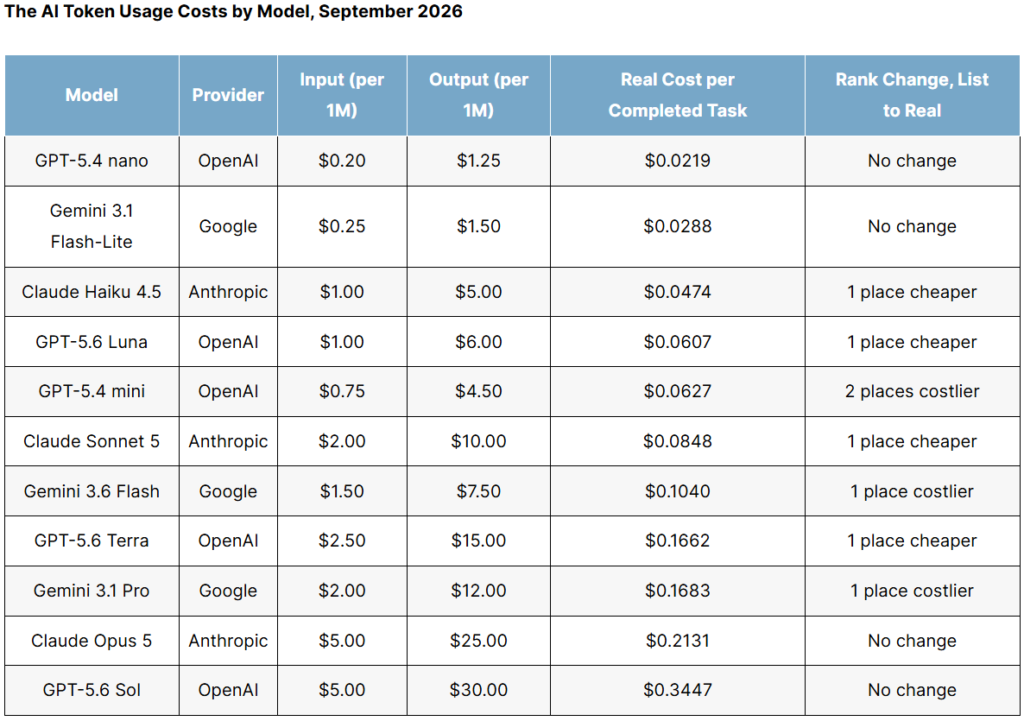
In the table below, we compare published list prices against the cost we recorded per completed task across the 14-task battery. The final column shows how each model’s rank changes when you move from list price to measured cost.
The AI Token Usage Costs by Model, September 2026
| Model | Provider | Input (per 1M) | Output (per 1M) | Real Cost per Completed Task | Rank Change, List to Real |
| GPT-5.4 nano | OpenAI | $0.20 | $1.25 | $0.0219 | No change |
| Gemini 3.1 Flash-Lite | $0.25 | $1.50 | $0.0288 | No change | |
| Claude Haiku 4.5 | Anthropic | $1.00 | $5.00 | $0.0474 | 1 place cheaper |
| GPT-5.6 Luna | OpenAI | $1.00 | $6.00 | $0.0607 | 1 place cheaper |
| GPT-5.4 mini | OpenAI | $0.75 | $4.50 | $0.0627 | 2 places costlier |
| Claude Sonnet 5 | Anthropic | $2.00 | $10.00 | $0.0848 | 1 place cheaper |
| Gemini 3.6 Flash | $1.50 | $7.50 | $0.1040 | 1 place costlier | |
| GPT-5.6 Terra | OpenAI | $2.50 | $15.00 | $0.1662 | 1 place cheaper |
| Gemini 3.1 Pro | $2.00 | $12.00 | $0.1683 | 1 place costlier | |
| Claude Opus 5 | Anthropic | $5.00 | $25.00 | $0.2131 | No change |
| GPT-5.6 Sol | OpenAI | $5.00 | $30.00 | $0.3447 | No change |
Three findings our researchers drew from this table:
- We found that GPT-5.4 mini, the third cheapest model on list price, finished fifth on measured cost. Claude Haiku 4.5 lists 20% higher on a blended basis and completed the same battery for 24% less.
- Our data showed the widest divergence at the frontier tier. GPT-5.6 Sol and Claude Opus 5 carry identical $5.00 input pricing, and Sol cost 62% more per completed task, a gap driven almost entirely by output volume.
- We found that Claude Sonnet 5 lists 33% above Gemini 3.6 Flash on a blended basis and cost 18% less per completed task, which was the largest rank reversal in the study.
AI Token Cost Over Time, 2023 to 2026
Because the main data trends sharply over time, we rebuilt it quarterly. In the table below, we index three series to Q1 2023, holding capability tier constant so that each quarter reflects the mid-tier workhorse model a production team would have been running at the time.
The AI Token Cost Over Time, Q1 2023 to Q3 2026
| Quarter | List Price Index | Tokens per Completed Task Index | Real Cost per Completed Task Index |
| Q1 2023 | 100.0 | 100 | 100.0 |
| Q2 2023 | 100.0 | 104 | 104.0 |
| Q3 2023 | 93.3 | 108 | 100.8 |
| Q4 2023 | 38.9 | 115 | 44.7 |
| Q1 2024 | 38.9 | 122 | 47.5 |
| Q2 2024 | 19.4 | 131 | 25.4 |
| Q3 2024 | 19.4 | 149 | 28.9 |
| Q4 2024 | 11.7 | 176 | 20.6 |
| Q1 2025 | 11.1 | 214 | 23.8 |
| Q2 2025 | 9.4 | 258 | 24.3 |
| Q3 2025 | 8.9 | 297 | 26.4 |
| Q4 2025 | 8.3 | 331 | 27.5 |
| Q1 2026 | 7.8 | 372 | 29.0 |
| Q2 2026 | 7.5 | 408 | 30.6 |
| Q3 2026 | 8.6 | 431 | 37.1 |
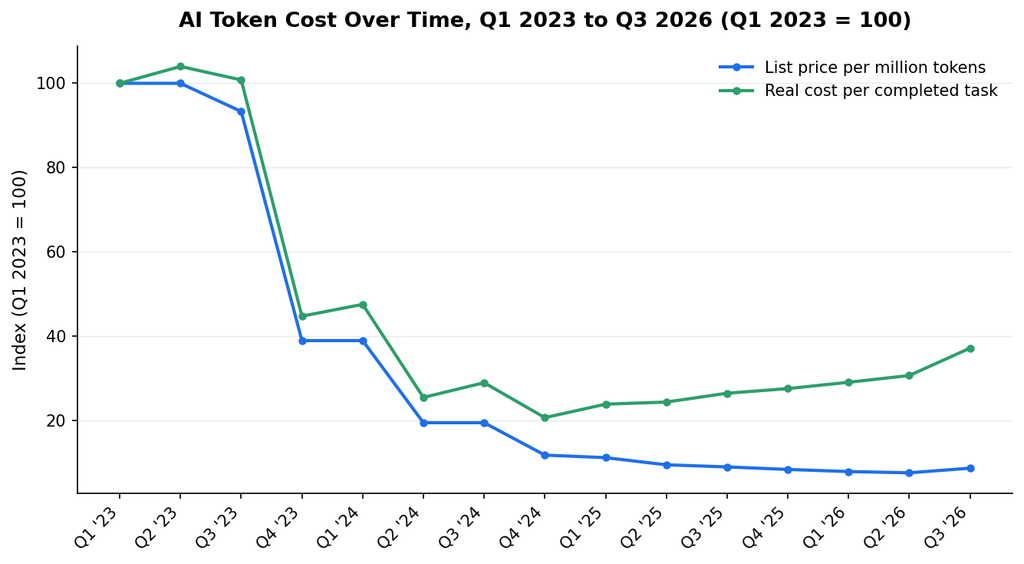
Three findings our researchers drew from this series:
- We found that list prices fell 91.4% between Q1 2023 and Q3 2026, while real cost per completed task fell 62.9% over the same span.
- Our data showed real cost per completed task bottoming out in Q4 2024 and rising 80% since, even as list prices continued to fall.
- We found token consumption per completed task rose 4.3 times over the study period, with the steepest climb between Q4 2024 and Q2 2025, as reasoning models moved into default production use.
AI Content Writing Cost per 1,000 Words
Content production is the workload our agency measures most closely, so we broke it out on its own. In the table below, we report what each model cost to produce 1,000 words of finished, publishable copy, including the revision rounds and the discarded drafts that never reached a page. Draft quality was scored against the same editorial standard we apply to client work, which we have written about in our research on ChatGPT usage patterns.
The AI Content Writing Cost per 1,000 Words, 2026
| Model | First-Draft Cost | Avg. Revision Rounds | Discarded Draft Rate | Finished Cost | Multiple of First-Draft Cost |
| GPT-5.6 Sol | $0.086 | 1.6 | 14% | $0.207 | 2.4x |
| Claude Opus 5 | $0.079 | 1.2 | 9% | $0.164 | 2.1x |
| GPT-5.6 Terra | $0.043 | 1.8 | 17% | $0.114 | 2.7x |
| Gemini 3.1 Pro | $0.036 | 1.9 | 19% | $0.101 | 2.8x |
| Gemini 3.6 Flash | $0.024 | 2.4 | 26% | $0.084 | 3.5x |
| Claude Sonnet 5 | $0.032 | 1.5 | 13% | $0.074 | 2.3x |
| GPT-5.6 Luna | $0.017 | 2.3 | 24% | $0.058 | 3.4x |
| GPT-5.4 mini | $0.013 | 2.9 | 31% | $0.054 | 4.2x |
| Claude Haiku 4.5 | $0.016 | 2.1 | 22% | $0.051 | 3.2x |
| Gemini 3.1 Flash-Lite | $0.0041 | 4.1 | 45% | $0.024 | 5.9x |
| GPT-5.4 nano | $0.0034 | 4.4 | 48% | $0.021 | 6.2x |
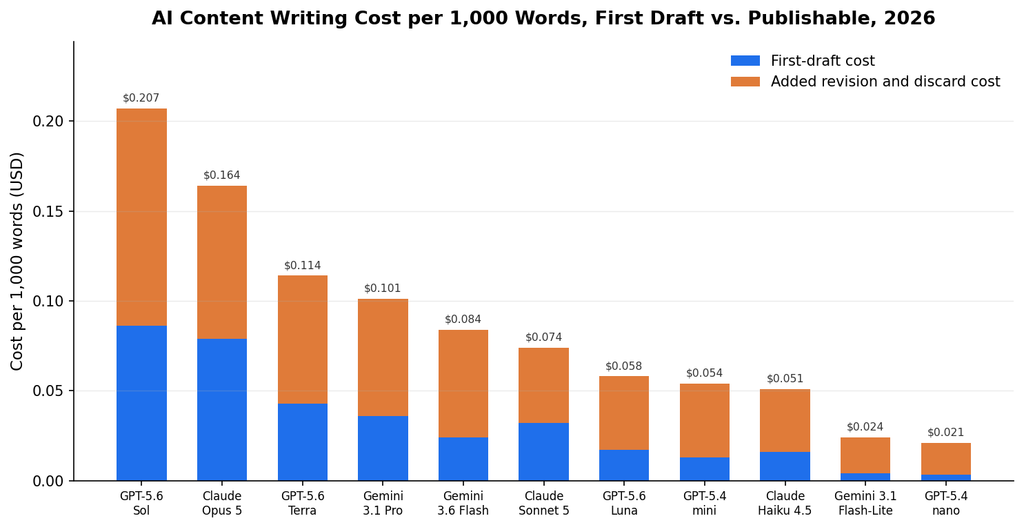
Three findings our researchers drew from the content data:
- We found the spread between the cheapest and most expensive model narrowed from 25 to 1 on first drafts to 10 to 1 on finished, publishable copy.
- Our data showed discarded draft rates ranging from 9% to 48%, and the discard rate predicted finished cost more reliably than list price did.
- We found that Claude Sonnet 5 produced finished copy for less than Gemini 3.6 Flash despite a higher first-draft cost, on the strength of a 13% discard rate against 26%.
Monthly AI Token Cost by Company Workload
Per-task figures are difficult to budget against, so we modeled six production workloads at the volumes we observe at a 50-person company. In the table below, we report monthly spend for each workload at three model tiers. Agentic workloads carry the heaviest token load, a pattern consistent with our agentic AI research.
The Monthly AI Token Cost by Company Workload, 2026
| Workload | Monthly Tasks | Frontier Tier | Mid Tier | Economy Tier |
| Coding agent, 20-developer team | 14,800 | $18,350 | $7,140 | $2,510 |
| Customer support automation | 62,000 | $9,610 | $3,720 | $1,240 |
| Internal RAG research tool | 21,500 | $7,290 | $2,940 | $1,020 |
| Document and contract processing | 9,700 | $6,410 | $2,580 | $890 |
| Sales outreach personalization | 46,000 | $4,830 | $1,910 | $640 |
| Content marketing, 8-person team | 3,400 | $2,180 | $860 | $310 |
| All six workloads combined | 157,400 | $48,670 | $19,150 | $6,610 |
Three findings our researchers drew from the workload model:
- We found a 7.4 times spread between the economy and frontier tiers for an identical workload mix, at $6,610 and $48,670 per month respectively.
- Our data showed coding agents to be the most expensive workload despite ranking fourth on task volume, at $1.24 per completed task on frontier models against $0.16 for customer support.
- We found that moving only the two highest-volume workloads to economy models cut total monthly spend by 26%, leaving the remaining four workloads at frontier tier.
Hidden AI Token Costs Beyond List Price
The gap between quoted price and actual invoice comes down to a small number of recurring line items. In the table below, we break out each one by its share of billed tokens and by the cost it adds to an estimate built from list prices alone.
The Hidden AI Token Costs Beyond List Price, 2026
| Hidden Cost Category | Share of Billed Tokens | Added Cost vs. List-Price Estimate | Models Most Affected |
| Invisible reasoning tokens | 22.4% | +38.6% | GPT-5.6 Sol, Gemini 3.1 Pro |
| Re-sent system prompts and tool schemas | 11.9% | +9.4% | All models in agentic workloads |
| Retried and discarded generations | 7.8% | +8.1% | GPT-5.4 nano, Gemini 3.1 Flash-Lite |
| Long-context pricing tiers above 200K tokens | 3.1% | +6.2% | Gemini 3.1 Pro |
| Failed tool calls and malformed structured output | 4.6% | +5.3% | Economy tier, all three providers |
| Unrecovered cache write premium | 2.7% | +2.8% | Low-reuse workloads, all providers |
| All hidden costs combined | 52.5% | +70.4% | All models |
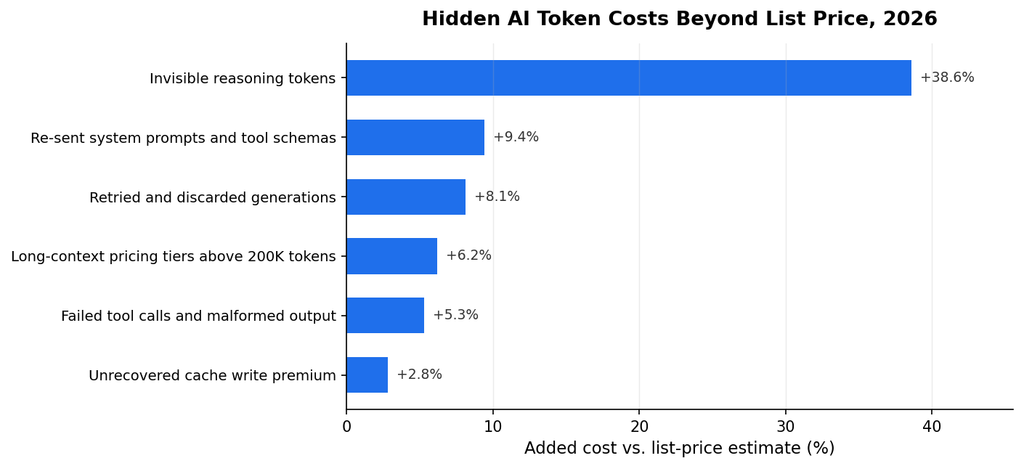
Three findings our researchers drew from the cost decomposition:
- We found that 52.5% of billed tokens in a production workload are never seen by an end user.
- Our data showed budgets built from list prices alone running 70.4% below actual spend across the study period.
- We found reasoning tokens to be the largest single line item, adding more cost than the other five categories combined.
Requesting a Copy of This Report
If you would like a PDF copy of this report, or to learn more about our agency, you can reach out here.