From September 1 to November 6, 2026, our research team recorded how AI platforms describe 483 companies across 10 industries. For each company, we collected its AI brand sentiment reading from four widely used tracking tools: Semrush AI Visibility Toolkit, Profound, OtterlyAI, and Peec AI. Every company in the dataset is a single brand with annual revenue under $1 billion.
AI brand sentiment is the tone an AI platform uses when it describes a company in its answers. A description can be favorable, neutral, or critical. There is no shared standard for scoring it, and each tool reports sentiment on its own scale. A benchmark is most useful when it is stated in the units a marketing team sees in its own dashboard, so this report gives the 25th, 50th, and 75th percentile on each tool’s scale. The table below lists the measure we used from each tool.
Sentiment Measure Reported by Each Tool
| Tool | Measure Used in This Study | Scale |
| Semrush AI Visibility Toolkit | Favorable sentiment percentage | 0% to 100% |
| Profound | Positive sentiment percentage | 0% to 100% |
| OtterlyAI | Net Sentiment Score | -100 to +100 |
| Peec AI | Sentiment score | 0 to 100 |
In the sections below, we break down the benchmarks by industry and by company size, and then compare them with outside research on AI sentiment.
Summary of Findings
- The median company in our study scored 77.1% favorable on Semrush, 83.2% positive on Profound, +68.4 on OtterlyAI, and 77.3 on Peec AI.
- Manufacturing & industrial products had the most favorable sentiment on all four tools. Financial services & fintech had the least favorable sentiment on all four tools.
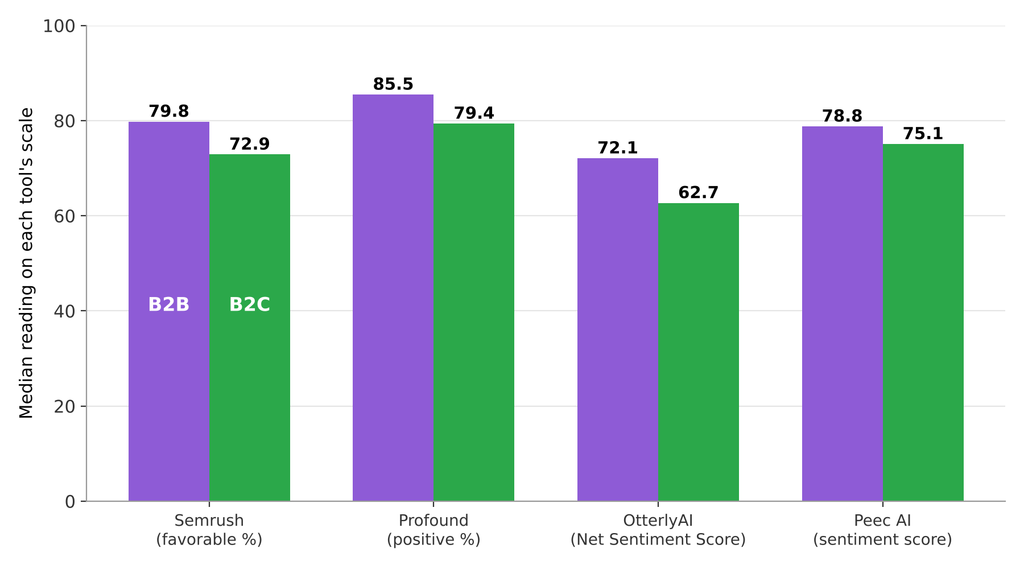
- B2B companies were described more favorably than B2C companies on every tool. On Semrush, the median was 79.8% for B2B and 72.9% for B2C.
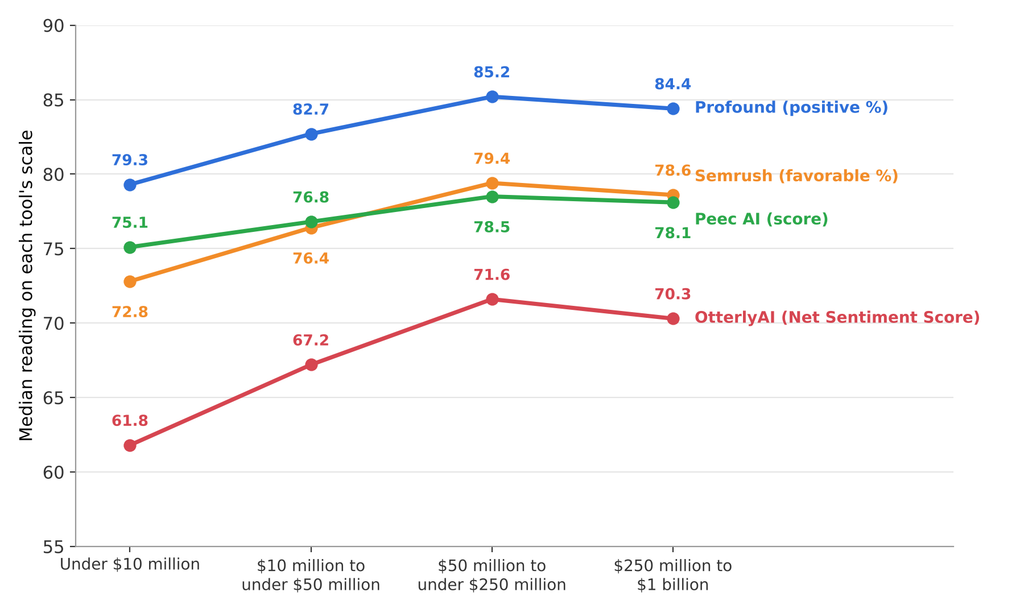
- Sentiment improved with company size up to $250 million in annual revenue and then leveled off. The median on Semrush was 72.8% for companies under $10 million, 79.4% for companies between $50 million and $250 million, and 78.6% for companies between $250 million and $1 billion.
- Readings from different tools are separate scales and cannot be converted into one another. Outside research agrees with the overall pattern that AI platforms describe most companies favorably.
AI Brand Sentiment Benchmarks by Industry
In the table below, we break down AI brand sentiment by industry and by customer type. The table shows the 25th, 50th, and 75th percentile for each tool. Semrush and Profound figures are percentages, and OtterlyAI and Peec AI figures are scores.
AI Brand Sentiment Benchmarks by Industry (2026)
| Industry / Segment | Semrush | Profound | OtterlyAI | Peec AI | ||||||||
| 25th | 50th | 75th | 25th | 50th | 75th | 25th | 50th | 75th | 25th | 50th | 75th | |
| B2B SaaS & enterprise software | 68.3 | 79.6 | 90.4 | 73.8 | 85.1 | 93.7 | +54.2 | +72.6 | +86.3 | 72.4 | 78.6 | 85.2 |
| Manufacturing & industrial products | 73.1 | 83.8 | 93.2 | 79.4 | 89.2 | 96.1 | +61.4 | +77.8 | +89.1 | 74.1 | 80.3 | 86.7 |
| Financial services & fintech | 55.7 | 69.4 | 83.6 | 62.3 | 76.8 | 88.4 | +32.8 | +56.4 | +74.9 | 66.8 | 73.1 | 80.6 |
| Healthcare services & medical devices | 64.9 | 77.8 | 89.1 | 70.6 | 83.4 | 92.7 | +49.6 | +69.2 | +83.7 | 70.9 | 77.2 | 83.9 |
| Professional & business services | 70.2 | 81.3 | 91.6 | 75.7 | 86.4 | 94.8 | +56.7 | +74.1 | +87.2 | 73.2 | 79.4 | 85.8 |
| Real estate & property services | 60.4 | 73.9 | 86.2 | 66.8 | 80.1 | 90.6 | +42.3 | +63.6 | +80.4 | 68.7 | 75.4 | 82.3 |
| IT services & cybersecurity | 64.1 | 76.5 | 88.7 | 70.2 | 82.6 | 92.1 | +48.9 | +67.8 | +83.1 | 70.4 | 76.8 | 83.6 |
| D2C brands & e-commerce | 57.6 | 71.8 | 84.9 | 63.9 | 78.2 | 89.3 | +35.4 | +59.7 | +77.6 | 67.6 | 74.3 | 81.4 |
| Logistics & transportation | 67.8 | 79.2 | 90.1 | 73.4 | 84.9 | 93.5 | +54.1 | +71.8 | +85.6 | 72.1 | 78.2 | 84.7 |
| Consumer & home services | 59.8 | 73.6 | 86.4 | 66.1 | 80.3 | 90.9 | +40.2 | +63.9 | +80.8 | 68.9 | 75.6 | 82.5 |
| Overall (483) | 64.3 | 77.1 | 89.2 | 70.1 | 83.2 | 92.8 | +48.7 | +68.4 | +84.2 | 70.6 | 77.3 | 84.1 |
| B2B (330) | 68.1 | 79.8 | 90.7 | 73.6 | 85.5 | 94.1 | +54.3 | +72.1 | +86.7 | 72.3 | 78.8 | 85.3 |
| B2C (153) | 59.1 | 72.9 | 85.8 | 65.2 | 79.4 | 90.2 | +38.9 | +62.7 | +79.8 | 68.2 | 75.1 | 82.2 |
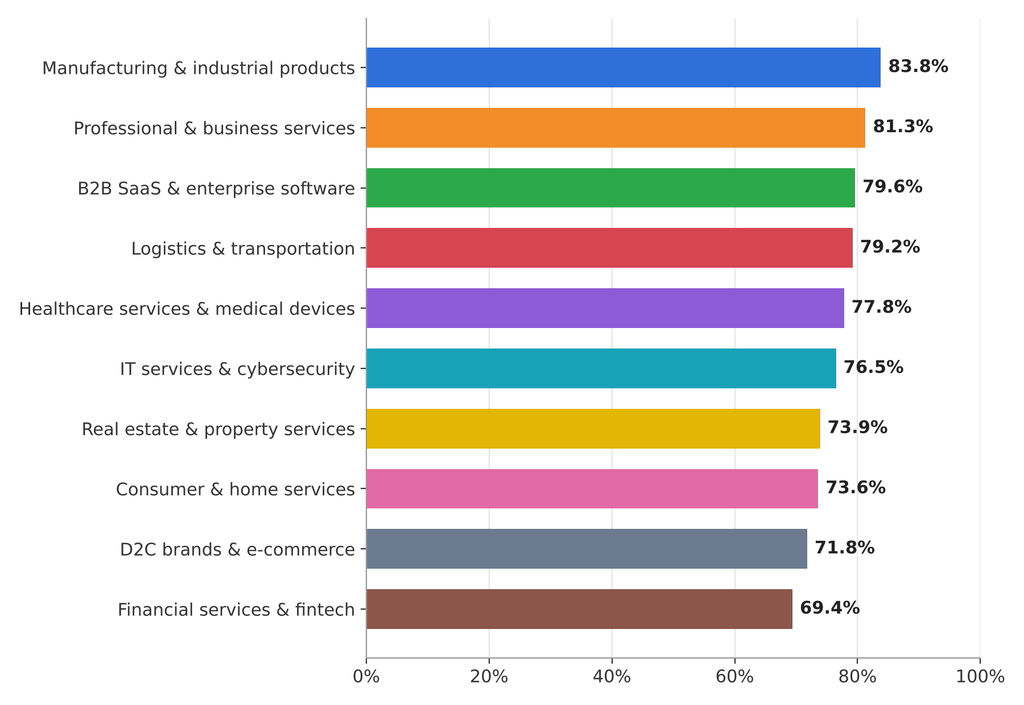
The chart below ranks the 10 industries by their median favorable sentiment percentage on Semrush. The order of industries was nearly identical on the other three tools.
Median Favorable Sentiment Percentage by Industry (Semrush)
The next chart compares the median B2B company with the median B2C company on each tool.
Median AI Brand Sentiment: B2B and B2C Companies
Our team took the following from the industry data:
- We found that the four tools agreed on which industries are described most favorably. The six highest-ranked industries appeared in the same order on every tool, led by manufacturing & industrial products, professional & business services, and B2B SaaS & enterprise software.
- Our data showed that the four lowest-ranked industries all serve consumers directly or handle personal money and property: financial services & fintech, D2C brands & e-commerce, real estate & property services, and consumer & home services. These industries have large volumes of public reviews and complaints, which AI platforms draw on when they describe a company.
- We found that the size of the gap between industries depends on the tool. The distance between the highest and lowest industry median was 14.4 points on Semrush, 12.4 points on Profound, 21.4 points on OtterlyAI, and 7.2 points on Peec AI.
AI Brand Sentiment Benchmarks by Company Size
In the table below, we group the same 483 companies by annual revenue. The table shows the 25th, 50th, and 75th percentile on each tool’s scale.
AI Brand Sentiment Benchmarks by Company Size (2026)
| Annual Revenue | Semrush | Profound | OtterlyAI | Peec AI | ||||||||
| 25th | 50th | 75th | 25th | 50th | 75th | 25th | 50th | 75th | 25th | 50th | 75th | |
| Under $10 million | 59.6 | 72.8 | 86.1 | 65.8 | 79.3 | 90.4 | +41.3 | +61.8 | +79.6 | 68.4 | 75.1 | 82.2 |
| $10 million to under $50 million | 63.7 | 76.4 | 88.8 | 69.6 | 82.7 | 92.3 | +47.6 | +67.2 | +83.4 | 70.2 | 76.8 | 83.7 |
| $50 million to under $250 million | 67.2 | 79.4 | 90.6 | 72.8 | 85.2 | 94.1 | +52.4 | +71.6 | +86.1 | 71.8 | 78.5 | 85.2 |
| $250 million to $1 billion | 65.8 | 78.6 | 90.1 | 71.5 | 84.4 | 93.6 | +49.8 | +70.3 | +85.7 | 71.1 | 78.1 | 84.8 |
The chart below plots the median reading for each revenue band on all four tools.
Median AI Brand Sentiment by Company Size
Our team took the following from the company size data:
- We found that sentiment rose through the first three revenue bands on every tool and peaked among companies with $50 million to under $250 million in revenue.
- Our data showed a small decline in the largest revenue band on all four tools. The median fell by 0.8 points on Semrush and Profound, 1.3 points on OtterlyAI, and 0.4 points on Peec AI. Larger companies have more press coverage and more customer reviews, and that record includes more criticism for AI platforms to repeat.
- We found that the smallest companies had the widest range of outcomes. The distance between the 25th and 75th percentile on Semrush was 26.5 points for companies under $10 million, compared with 23.4 points for companies with $50 million to under $250 million.
AI Brand Sentiment Benchmarks Compared With Outside Research
To test our benchmarks, we compared them with five outside sources that published figures on AI sentiment in 2026. As with our own data, each source uses its own measure, so the comparison is about direction and range. The table below lists each source with its sample, its measure, and its finding.
Outside AI Brand Sentiment Benchmarks (2026)
| Source | Sample | Measure | Reported Finding |
| First Page Sage | 483 companies with revenue under $1 billion | Four tool scales | Medians of 77.1% (Semrush), 83.2% (Profound), +68.4 (OtterlyAI), and 77.3 (Peec AI) |
| Peec AI | Guidance for all Peec AI users | Sentiment score, 0 to 100 | Most scores fall between 65 and 85 |
| SISTRIX | Brands tracked in SISTRIX AI Check | Net sentiment, -100 to +100 | The average across brands is close to +50 |
| ThriveStack | 100 category-leading SaaS brands | Sentiment score, 0 to 100 | Scores ranged from 70 to 98 |
| rocketblue | 1.8 million AI responses that mention brands | Each mention classed as positive, neutral, or negative | 80.6% neutral, 18.4% positive, and 1% negative |
| SE Ranking | 900 ChatGPT responses to 180 prompts | Net sentiment, -100 to +100 | Neutral prompts averaged about +20; scores moved an average of 27 points between runs |
Our team took the following from the comparison:
- We found that our Peec AI benchmarks match the range Peec AI gives its own users. The middle half of companies in our study scored between 70.6 and 84.1, inside the 65 to 85 range that Peec AI describes as typical.
- Our data showed higher net sentiment than the outside figures: a median of +68.4 on OtterlyAI, compared with an average near +50 at SISTRIX and about +20 in SE Ranking’s test. Each of the three uses its own classification of praise and criticism. SE Ranking also tested consumer categories only (televisions, telehealth, and airline loyalty programs), and consumer brands scored lower in our study as well.
- We found that every source agrees negative descriptions are rare. In rocketblue’s dataset, 1% of brand mentions were negative. In our study, even the company at the 25th percentile had clearly positive net sentiment in every industry, with a low of +32.8 in financial services & fintech.
One difference between the sources requires an explanation. rocketblue classed four in five brand mentions as neutral, while the median company in our study was 77.1% favorable on Semrush and 83.2% positive on Profound. The reason is that the measures count different things. rocketblue classified every mention of a brand, including brief ones that carry no opinion. Semrush divides mentions into favorable and general, and Profound reports the positive share of the claims AI platforms make about a brand. A company can therefore be mentioned neutrally most of the time and still score well on both tools.
SE Ranking’s finding on variability also matters for anyone using these benchmarks. Because a score can move by 27 points from one run of a prompt to the next, a single reading should be compared with a benchmark only after several weeks of tracking.
Study Composition
In the tables below, we show how the 483 companies in the study are distributed by industry and by annual revenue. Each company was evaluated as one brand. By customer type, 330 companies (68.3%) are B2B and 153 companies (31.7%) are B2C.
Companies in the Study by Industry (2026)
| Industry | Companies | Share of Sample |
| B2B SaaS & enterprise software | 85 | 17.6% |
| Manufacturing & industrial products | 74 | 15.3% |
| Financial services & fintech | 60 | 12.4% |
| Healthcare services & medical devices | 49 | 10.1% |
| Professional & business services | 47 | 9.7% |
| Real estate & property services | 46 | 9.5% |
| IT services & cybersecurity | 37 | 7.7% |
| D2C brands & e-commerce | 35 | 7.2% |
| Logistics & transportation | 26 | 5.4% |
| Consumer & home services | 24 | 5.0% |
| Total | 483 | 100.0% |
Companies in the Study by Annual Revenue (2026)
| Annual Revenue | Companies | Share of Sample |
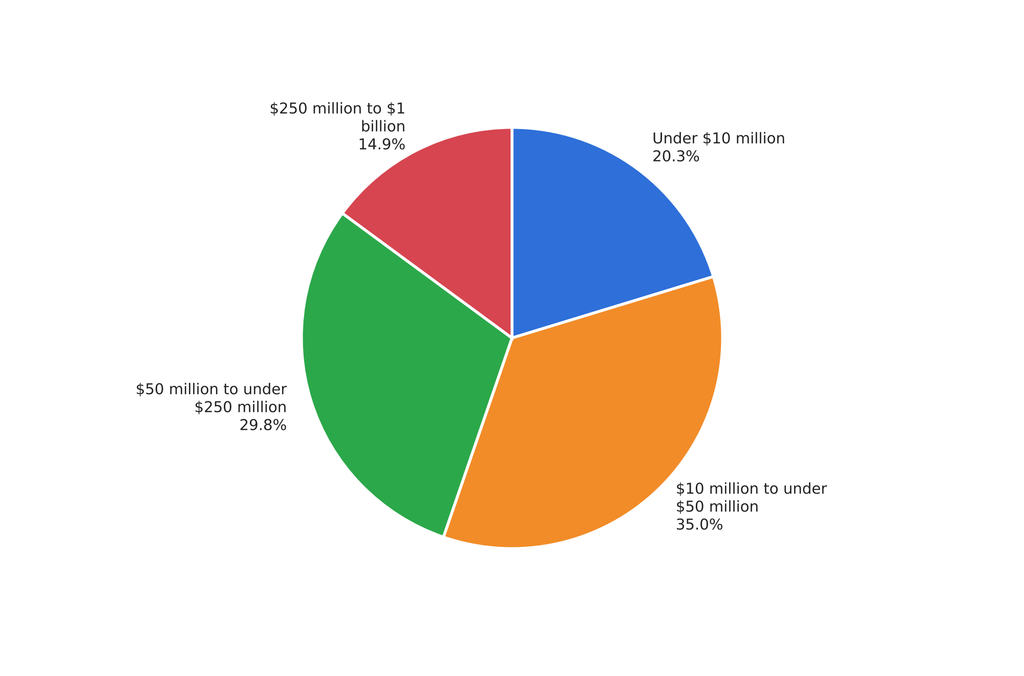
| Under $10 million | 98 | 20.3% |
| $10 million to under $50 million | 169 | 35.0% |
| $50 million to under $250 million | 144 | 29.8% |
| $250 million to $1 billion | 72 | 14.9% |
| Total | 483 | 100.0% |
Percentages may not sum to 100.0% due to rounding.
Companies in the Study by Annual Revenue
Our team took the following from the composition of the study:
- Companies with $10 million to under $250 million in annual revenue make up 64.8% of the sample, so the overall benchmarks are most representative of the mid-market.
- B2B companies outnumber B2C companies by about two to one. Because B2B companies scored higher, the overall medians are closer to the B2B medians than to the B2C medians.
- Each company has a separate reading on each of the four tools. The four columns in this report are independent distributions, and a score on one tool does not predict an exact score on another.
Requesting a Copy of This Report
If you’d like to request a PDF copy of this report or learn more about our agency, you can reach out here.
- First Page Sage Research Study. First Page Sage. November 2026. San Francisco, California.
- Brand Performance Reports. Semrush. 2026. Boston, Massachusetts.
- About Sentiment. Profound. June 15, 2026. New York, New York.
- Brand Sentiment Tracking in AI Search. Thomas Peham, OtterlyAI. August 4, 2026. Vienna, Austria.
- Sentiment. Peec AI. 2026. Berlin, Germany.
- AI Search: Sentiment Analysis. Henk Wellnitz, SISTRIX. August 12, 2026. Bonn, Germany.
- Tracking Brand Mentions in AI Chatbots (Feb 2026 Data). Michael Hermon, rocketblue. February 14, 2026.
- Does Prompt Sentiment Change How ChatGPT Talks About Brands? What 900 Responses Showed. Celeste Gonzalez, SE Ranking. November 4, 2026.
- AI Visibility Benchmarks 2026: Empirical Study Across 100 SaaS Brands. ThriveStack. August 2026.