Last updated October 27, 2026
Between 2022 and Q3 2026, our legal SEO team performed a comprehensive review of our paid and organic marketing campaign data from 49 law firms we partnered with. These firms spanned multiple specialties (primarily personal injury) in 36 U.S. states. Altogether, the firms in our sample spent a combined average of $21.4 million annually on Google Ads, Facebook Ads, SEO, and generative engine optimization (GEO). Our objective was to benchmark the average cost per lead (CPL) in the highly competitive personal injury law market and identify the key factors that influenced it.
For all channels except generative engine optimization (GEO), we sourced data from campaigns active between January 2022 and September 2026. For GEO specifically, we sourced data from campaigns active between January 2024 and December 2025 because GEO was established as a marketing practice in late 2023, so campaign data from 2022 and 2023 does not exist.
Below is a summary of our findings, breaking down average personal injury CPL across channels, case types, and regions.
Average Personal Injury Cost Per Lead by Channel
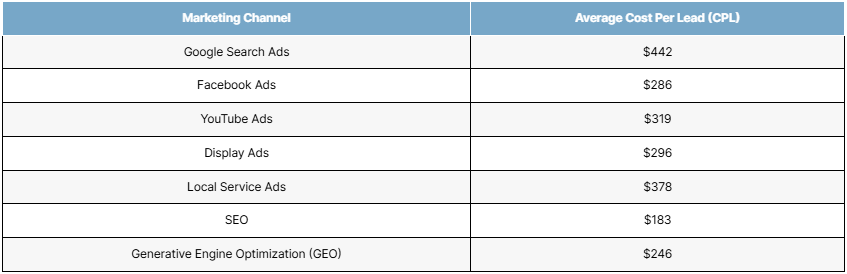
In the table below, we take a look at the average CPL for personal injury campaigns by marketing channel.
The Average Personal Injury Cost Per Lead by Channel – 2026
| Marketing Channel | Average Cost Per Lead (CPL) |
| Google Search Ads | $442 |
| Facebook Ads | $286 |
| YouTube Ads | $319 |
| Display Ads | $296 |
| Local Service Ads | $378 |
| SEO | $183 |
| Generative Engine Optimization (GEO) | $246 |
Key Insights:
- Google Search Ads command the highest CPL due to intense bidding on high-intent keywords.
- SEO offers the lowest average CPL and highest-compounding value over time, though ramp-up takes a few months.
- Generative Engine Optimization (optimizing for AI search responses) is an emerging but effective strategy with competitive CPLs and growing ROI.
Personal Injury CPL by Case Type
The table below lays out the average CPL for each of the five most common case types in our dataset. We do not include other case types below (e.g., dog bites, defamation) if there is insufficient data in the legal marketing campaigns we analyzed.
The Average Personal Injury CPL by Case Type – 2026
| Case Type | Average CPL |
| Auto Accidents | $391 |
| Medical Malpractice | $512 |
| Product Liability | $476 |
| Slip and Fall | $312 |
| Workplace Injury | $354 |
Key Insights:
- Medical malpractice and product liability cases are the most expensive to acquire due to their complexity and potential for high settlement values.
- Slip and fall leads remain among the least expensive, though conversion rates to signed clients are also lower in this category.
Personal Injury CPL by Region
While many firms in our dataset practice in more than one region, the geographically segmented nature of the marketing campaigns we analyzed allowed our team to break down average personal injury CPLs by U.S. region in the table below.
The Average Personal Injury CPL by Region – 2026
| Region | Average CPL |
| Northeast | $468 |
| Midwest | $314 |
| South | $389 |
| West | $402 |
Researcher Notes:
- The Northeast exhibits the highest CPLs due to higher-than-average competition in metro areas such as New York and Boston.
- The Midwest maintains lower CPLs, partially due to less aggressive bidding and the less competitive nature of rural campaigns.
Requesting a Copy of This Report
If you’d like to request a PDF copy of this report or learn more about our agency, you can reach out here.re.