In anticipation of the Anthropic IPO, our research team built a quarterly financial model of Anthropic, the company behind Claude, covering January 2025 through September 2026. The model aggregates 21 sources, including the company’s funding announcements, reporting on its IPO prospectus, disclosures from its cloud and compute partners, and the API pricing and usage data we track across our own client campaigns.
Profitability at a frontier AI lab depends heavily on definitions, so we report it in layers. Gross margin measures revenue minus the cost of serving models to customers. Compute cost per dollar of revenue adds the cost of training new models. Adjusted operating income subtracts all operating expenses except stock-based compensation. One accounting choice shapes every figure: Anthropic books sales made through Amazon, Google, and Microsoft at the full customer price and records each partner’s share as a cost, which lowers its margins relative to a company that books those sales net. In the sections below, we break down Anthropic’s profitability by quarter, its revenue trajectory, its margins by business line, how it compares with OpenAI, and our outlook through 2028.
Anthropic Profitability by Quarter
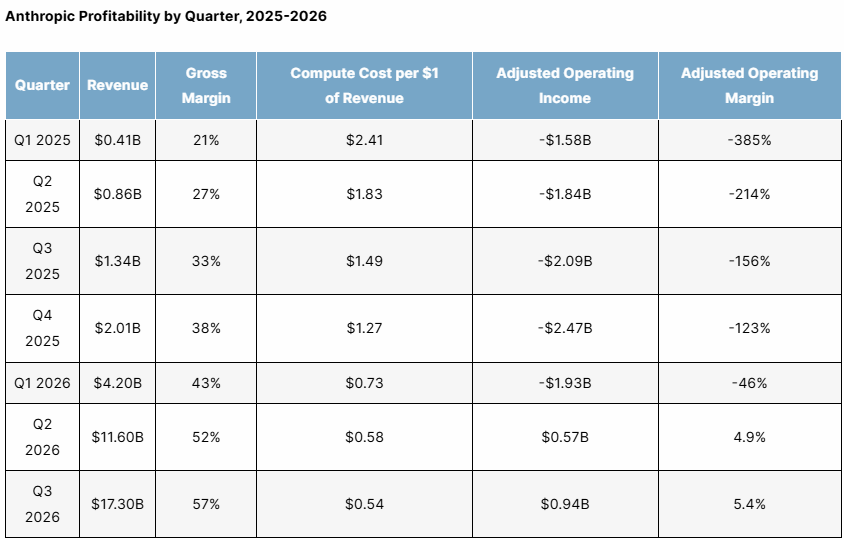
In the table below, we break down Anthropic’s revenue, margins, and adjusted operating income for each of the last seven quarters.
Anthropic Profitability by Quarter, 2025-2026
| Quarter | Revenue | Gross Margin | Compute Cost per $1 of Revenue | Adjusted Operating Income | Adjusted Operating Margin |
| Q1 2025 | $0.41B | 21% | $2.41 | -$1.58B | -385% |
| Q2 2025 | $0.86B | 27% | $1.83 | -$1.84B | -214% |
| Q3 2025 | $1.34B | 33% | $1.49 | -$2.09B | -156% |
| Q4 2025 | $2.01B | 38% | $1.27 | -$2.47B | -123% |
| Q1 2026 | $4.20B | 43% | $0.73 | -$1.93B | -46% |
| Q2 2026 | $11.60B | 52% | $0.58 | $0.57B | 4.9% |
| Q3 2026 | $17.30B | 57% | $0.54 | $0.94B | 5.4% |
Our team took three findings from this data:
- We found that Anthropic crossed into adjusted operating profit in Q2 2026, earning an estimated $570 million on $11.6 billion of revenue, and widened that profit in Q3.
- Our data showed compute cost per dollar of revenue falling from $2.41 in Q1 2025 to $0.54 in Q3 2026, the largest single driver of the turnaround.
- Across the four quarters of 2025, Anthropic lost an estimated $7.98 billion at the adjusted operating level on $4.62 billion of revenue.
Anthropic Run-Rate Revenue by Month
In the table below, we track Anthropic’s annualized run-rate revenue for each of the last 12 months, calculated as that month’s revenue multiplied by 12, alongside the run rate for Claude Code.
Anthropic Run-Rate Revenue by Month, 2025-2026
| Month | Anthropic Run Rate | Claude Code Run Rate | Claude Code Share |
| September 2025 | $5.8B | $0.9B | 15.5% |
| October 2025 | $6.4B | $1.1B | 17.2% |
| November 2025 | $7.4B | $1.4B | 18.9% |
| December 2025 | $9.4B | $1.9B | 20.2% |
| January 2026 | $12.1B | $2.2B | 18.2% |
| February 2026 | $15.3B | $2.7B | 17.6% |
| March 2026 | $22.9B | $4.1B | 17.9% |
| April 2026 | $30.8B | $6.3B | 20.5% |
| May 2026 | $49.3B | $9.2B | 18.7% |
| June 2026 | $58.9B | $11.4B | 19.4% |
| July 2026 | $64.2B | $13.1B | 20.4% |
| August 2026 | $69.7B | $14.6B | 20.9% |
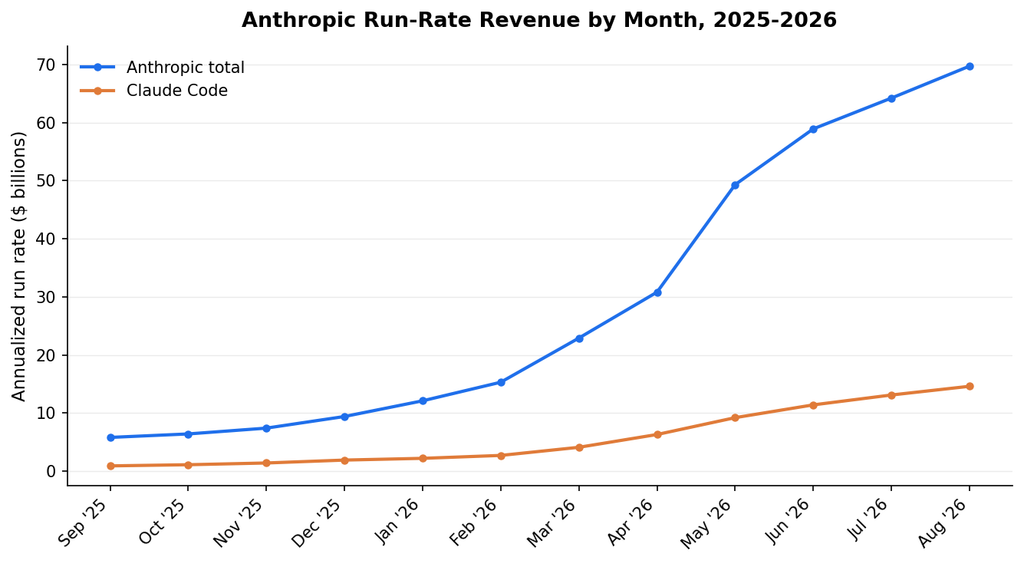
Run rate is the figure Anthropic uses in its own announcements, and it moves faster than booked revenue because it annualizes a single month. Between September 2025 and August 2026, our model shows the total run rate rising from $5.8 billion to $69.7 billion, a 12-fold increase. The steepest stretch came between April and May 2026, when the run rate climbed $18.5 billion in one month as several large enterprise agreements began billing. Claude Code held between 15% and 21% of the total throughout, which means its growth tracked the company’s rather than pulling away from it.
Anthropic Revenue and Gross Margin by Business Line
In the table below, we break down Anthropic’s Q2 2026 revenue and gross margin across its five business lines. Cloud partner revenue covers Claude sold through Amazon Bedrock, Google Cloud Vertex AI, and Microsoft Foundry.
Anthropic Revenue and Gross Margin by Business Line, 2026
| Business Line | Q2 2026 Revenue | Share of Revenue | Gross Margin |
| Direct API | $3.92B | 33.8% | 64% |
| Cloud Partner API | $2.68B | 23.1% | 34% |
| Claude Code | $2.25B | 19.4% | 48% |
| Team & Enterprise Seats | $1.46B | 12.6% | 69% |
| Pro & Max Subscriptions | $1.29B | 11.1% | 39% |
| Total | $11.60B | 100% | 52% |
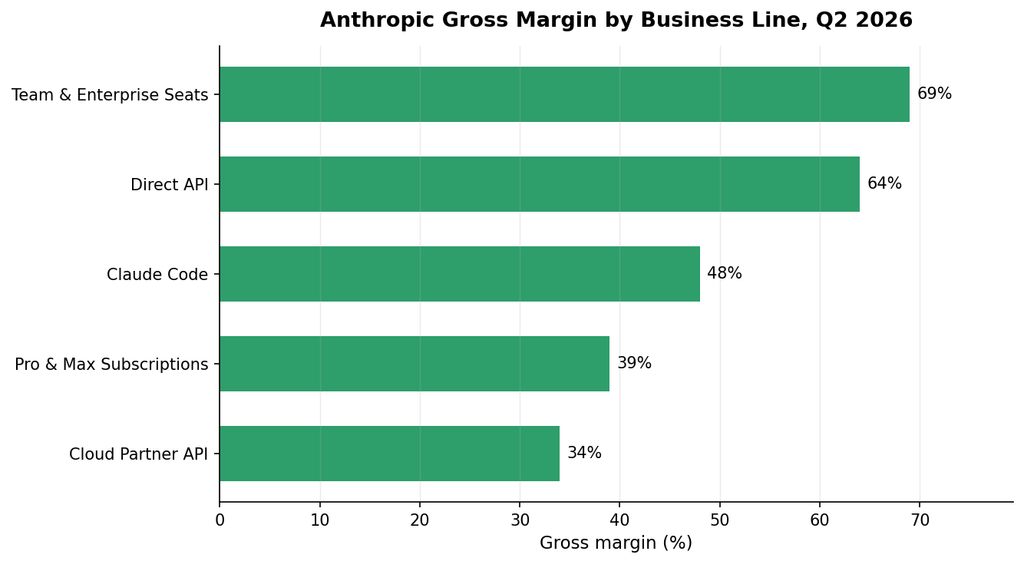
Three patterns stood out to our researchers:
- We found that Team and Enterprise seats carry Anthropic’s highest gross margin at 69%, since per-seat pricing is fixed while average usage per seat stays well below the cost ceiling.
- Our data showed the cloud partner channel producing 23.1% of revenue at a 34% gross margin, the lowest of any line, because each partner’s share is recorded as a cost.
- Claude Code accounted for 19.4% of revenue at a 48% gross margin, since its long agentic sessions consume more compute per dollar than standard API traffic.
Profitability Comparison: Anthropic vs OpenAI
In the table below, we compare Anthropic and OpenAI on the same five profitability measures for the first half of 2026.
Profitability Comparison: Anthropic vs OpenAI, 2026
| Metric (H1 2026) | Anthropic | OpenAI |
| Revenue | $15.80B | $12.60B |
| Gross Margin | 50% | 41% |
| Compute Cost per $1 of Revenue | $0.62 | $1.38 |
| Adjusted Operating Margin | -8.6% | -114% |
| Share of Revenue from Business Customers | 78% | 31% |
Our team drew three conclusions from the comparison:
- We found that Anthropic out-earned OpenAI by an estimated $3.2 billion in the first half of 2026, after trailing it in the first quarter.
- Our data showed a gap of roughly 105 points in adjusted operating margin between the two companies, at -8.6% for Anthropic and -114% for OpenAI.
- Anthropic generated 78% of its revenue from business customers compared with 31% at OpenAI, whose consumer-heavy user base, detailed in our ChatGPT usage statistics report, costs more to serve per dollar of revenue.
Anthropic Profitability Outlook
In the table below, we project Anthropic’s revenue and profitability through 2028. The 2025 figures are drawn from our quarterly model, and 2026 combines three modeled quarters with our Q4 forecast.
Anthropic Profitability Outlook, 2025-2028
| Year | Revenue | Gross Margin | Adjusted Operating Margin | Adjusted Operating Income |
| 2025 | $4.62B | 33% | -173% | -$7.98B |
| 2026 | $56.0B | 56% | 2.1% | $1.19B |
| 2027 | $121.4B | 60% | 11.4% | $13.84B |
| 2028 | $187.6B | 63% | 17.9% | $33.58B |
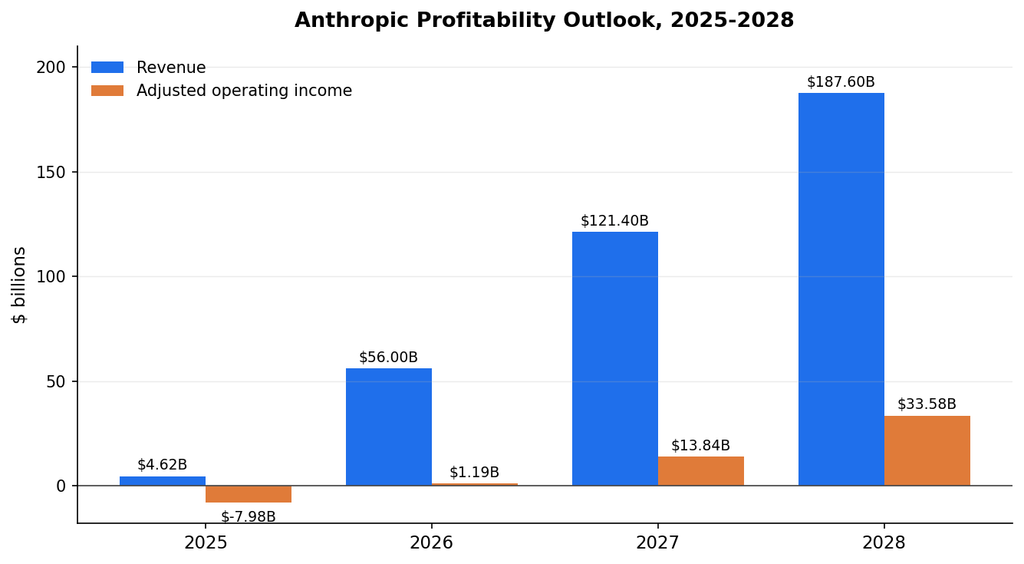
Our outlook assumes that gross margin keeps improving as inference hardware gets cheaper per token, and that training spend grows more slowly than revenue. On those assumptions, 2026 is Anthropic’s first full year of adjusted operating profit, at an estimated $1.19 billion. Two variables could move these figures most: the $1.25 billion monthly compute agreement for the Colossus clusters, whose full cost only began registering in the second half of 2026, and pricing pressure from lower-cost open-weight models. Profit on a GAAP basis will trail these adjusted figures because stock-based compensation and non-cash charges tied to financing instruments sit outside our definition. For the consumer side of the competitive picture, see our report on the top generative AI chatbots by market share.
Requesting a Copy of This Report
If you’d like to request a PDF copy of this report or learn more about our agency, you can reach out here.
Sources
- First Page Sage Research Study, First Page Sage, September 2026, San Francisco, California
- Anthropic’s Annualized Revenue Tops $65 Billion Before IPO, Bloomberg News, August 2026, New York, New York
- Anthropic Posts First Profitable Quarter in Frontier AI, Jon Markman, Forbes, August 2026, Jersey City, New Jersey
- Anthropic’s Gross Margin Is the Most Important Number in Tech, Yahoo Finance, June 2026, New York, New York
- Anthropic IPO Launch Shifts Toward Mid-October, CNBC, September 2026, Englewood Cliffs, New Jersey
- Anthropic’s Path From AI Startup to Industry-Defining IPO, Reuters, September 2026, London, United Kingdom