Between August 10 and November 6, 2026, our research team measured the AI share of voice of 647 companies across 10 industries. Every company in the dataset is a single brand with annual revenue under $1 billion, and about two thirds of them earn between $10 million and $250 million a year. The study was designed to describe typical companies, so the largest brands in each category were left out.
AI share of voice is a brand’s percentage of all brand mentions across the relevant AI responses. If the leading AI platforms mention brands 1,000 times across the prompts that matter in a category, and 54 of those mentions belong to one company, that company’s share of voice is 5.4%. For each company, we tracked the category-level prompts a buyer would use to find a provider and counted brand mentions on ChatGPT, Google Gemini (including AI Mode in Google Search), and Claude.
Most published figures on this metric describe category leaders, or come from the customer base of a single tracking tool. In the sections below, we report the 25th, 50th, and 75th percentile of AI share of voice by industry and by company size, and then compare our benchmarks with four outside datasets.
Summary of Findings
- The median company in our study held a 5.4% AI share of voice. The 25th percentile was 2.1%, and the 75th percentile was 11.2%.
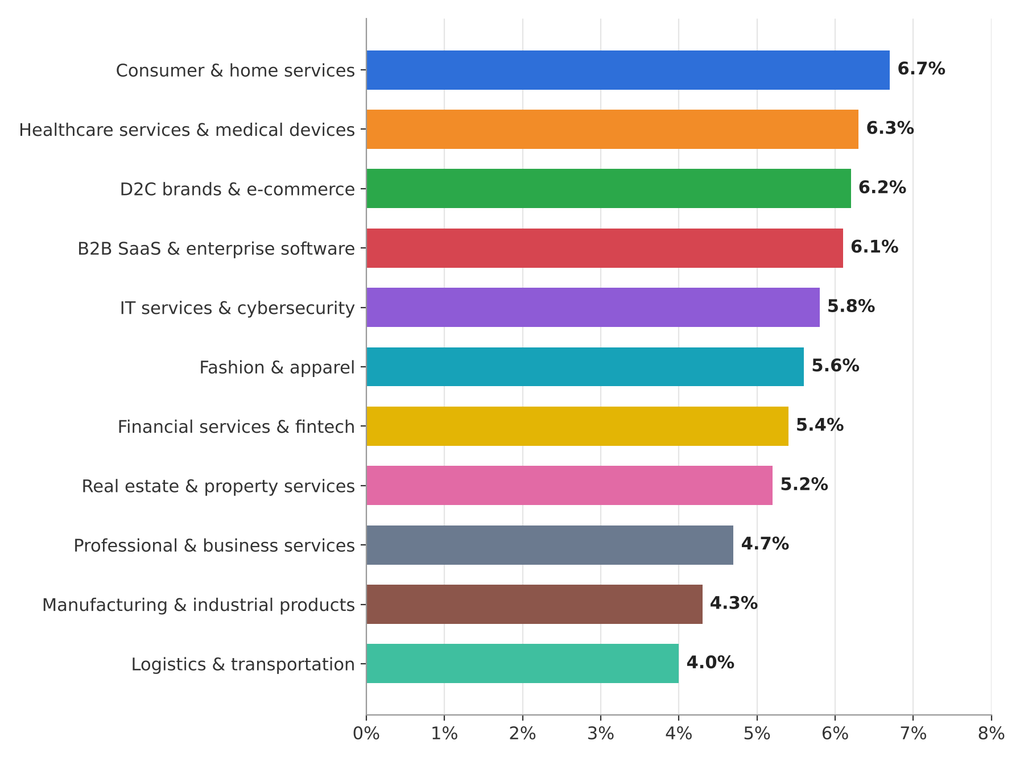
- Consumer & home services (6.7%), healthcare services & medical devices (6.3%), and D2C brands & e-commerce (6.2%) had the highest median share of voice. Logistics & transportation (4.0%) and manufacturing & industrial products (4.3%) had the lowest.
- B2C companies had a higher median share of voice (6.1%) than B2B companies (5.1%).
- Share of voice rose with company size. The median grew from 2.9% for companies under $10 million in revenue to 10.2% for companies between $250 million and $1 billion.
- Outside studies that use the same definition report industry averages of 2.6% to 7.5%, close to our medians. Studies of category leaders report 14% to 41%, which describes the top of each market.
AI Share of Voice Benchmarks by Industry
In the table below, we break down AI share of voice by industry and by customer type. The 50th percentile is the median company in each group. A company at the 75th percentile has a higher share of voice than three quarters of its peers.
AI Share of Voice Benchmarks by Industry (2026)
| Industry / Segment | 25th Percentile | 50th Percentile | 75th Percentile |
| B2B SaaS & enterprise software | 2.4% | 6.1% | 12.8% |
| Manufacturing & industrial products | 1.6% | 4.3% | 9.2% |
| Financial services & fintech | 2.1% | 5.4% | 11.7% |
| Healthcare services & medical devices | 2.5% | 6.3% | 13.1% |
| Professional & business services | 1.8% | 4.7% | 9.9% |
| Real estate & property services | 2.0% | 5.2% | 10.9% |
| IT services & cybersecurity | 2.2% | 5.8% | 12.1% |
| D2C brands & e-commerce | 2.4% | 6.2% | 12.6% |
| Fashion & apparel | 2.3% | 5.6% | 10.8% |
| Logistics & transportation | 1.5% | 4.0% | 8.6% |
| Consumer & home services | 2.6% | 6.7% | 13.5% |
| Overall | 2.1% | 5.4% | 11.2% |
| B2B | 2.0% | 5.1% | 10.7% |
| B2C | 2.3% | 6.1% | 12.4% |
The chart below ranks the 11 industry groups by their median share of voice.
Median AI Share of Voice by Industry
Our team took the following from the industry data:
- We found that industry medians fell within a narrow band, from 4.0% to 6.7%. The industry a company belongs to moved its expected share of voice by fewer than three percentage points.
- Our data showed that the gap inside each industry was far wider than the gap between industries. In every industry, the company at the 75th percentile had roughly five times the share of voice of the company at the 25th percentile.
- We found that industries with consumer or local buyers ranked highest. Prompts in consumer & home services tend to be tied to a city or region, so fewer brands compete for each answer and each brand takes a larger share of the mentions.
AI Share of Voice Benchmarks by Company Size
In the table below, we group the same 647 companies by annual revenue. This view answers a question we hear often from smaller companies: how much of the difference in share of voice comes down to size.
AI Share of Voice Benchmarks by Company Size (2026)
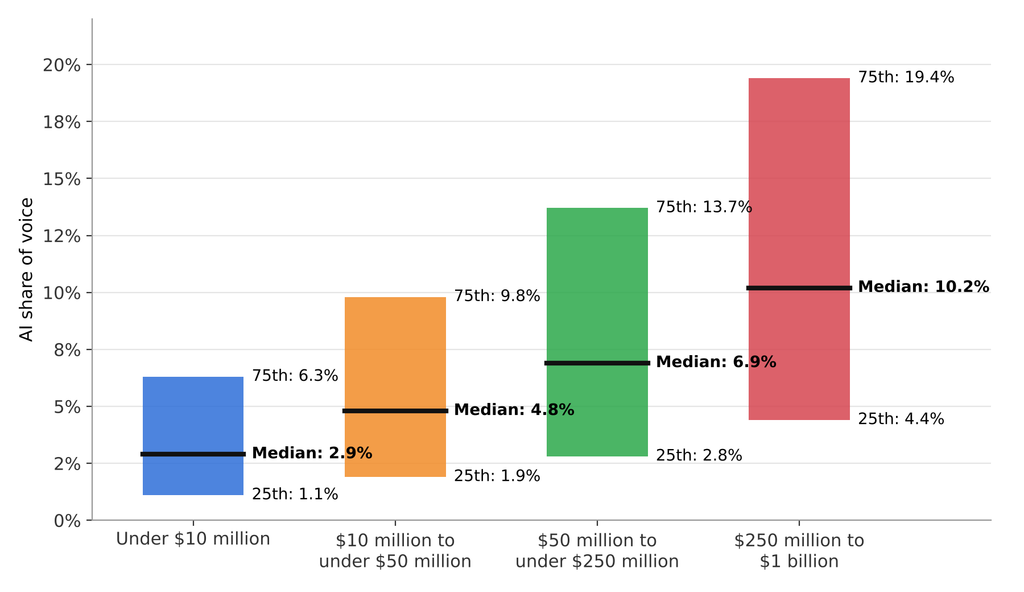
| Annual Revenue | 25th Percentile | 50th Percentile | 75th Percentile |
| Under $10 million | 1.1% | 2.9% | 6.3% |
| $10 million to under $50 million | 1.9% | 4.8% | 9.8% |
| $50 million to under $250 million | 2.8% | 6.9% | 13.7% |
| $250 million to $1 billion | 4.4% | 10.2% | 19.4% |
The chart below shows the middle half of companies in each revenue band, with the median marked by the black line.
AI Share of Voice by Company Size: 25th to 75th Percentile
Our team took the following from the company size data:
- We found that median share of voice more than tripled between the smallest and largest revenue bands, from 2.9% to 10.2%.
- Our data showed that company size explained more of the variation than industry did. Medians ranged from 2.9% to 10.2% across revenue bands, compared with 4.0% to 6.7% across industries.
- We found that smaller companies can still outperform larger ones. A company under $10 million at its 75th percentile (6.3%) had a higher share of voice than the median company in the $10 million to under $50 million band (4.8%), and came close to the median company in the $50 million to under $250 million band (6.9%).
AI Share of Voice Benchmarks Compared With Outside Studies
To test our benchmarks, we compared them with four outside sources that have published AI share of voice figures in 2026. The comparison requires care, because the sources do not all count the same thing. Semrush and Peec AI define share of voice the way we do, as a brand’s share of all brand mentions. Other sources weight mentions by platform usage, or count the share of AI responses that mention a brand at all. The table below lists each source with its sample and its definition.
Outside AI Share of Voice Benchmarks (2026)
| Source | Sample | How Share of Voice Is Defined | Reported Benchmark |
| First Page Sage | 647 companies with revenue under $1 billion | Brand’s share of all brand mentions | Median 5.4%; middle half of companies 2.1% to 11.2% |
| Promodo | 18 industries tracked on ChatGPT, Gemini, and AI Overviews | Brand’s share of all mentions in its niche | Industry averages 2.6% to 7.5%; industry leaders 5.1% to 23.2% |
| Presenc AI | 14 industries, 80 to 150 prompts each | Share of category mentions, weighted by platform usage | Category leaders 14% to 41%; top three brands combined 34% to 81% |
| ThriveStack | 100 category-leading SaaS brands, 50,000 prompts | Share of AI recommendations within a competitive group | 7.2% to 65.4% across the 100 brands |
| Stackmatix | Published tier guidance | Share of AI responses that mention the brand | Below 5% gap; 5% to 15% average; 15% to 25% strong; 25% to 30% leaders |
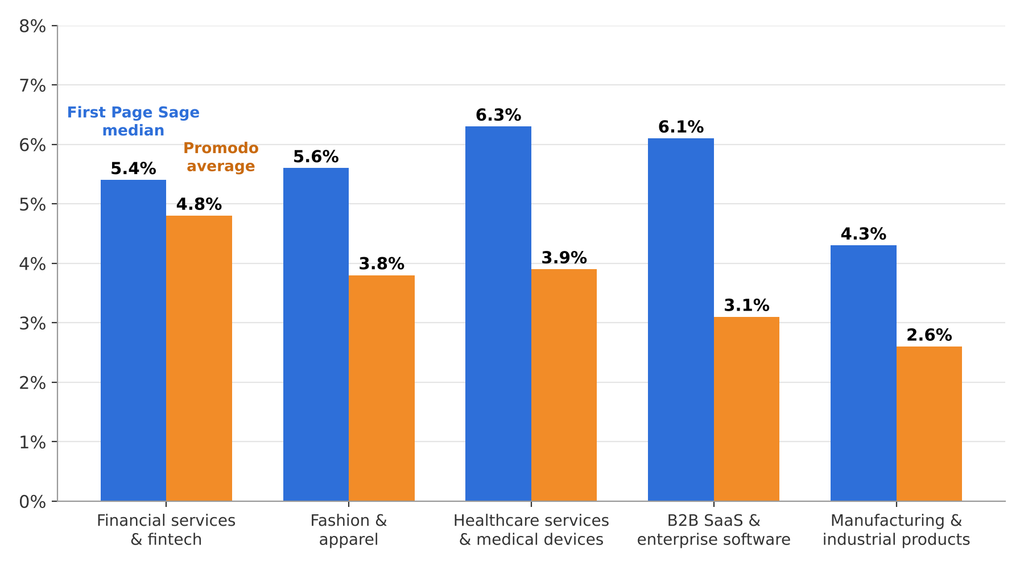
Promodo’s dataset is the closest match to ours, because it uses the same definition and reports by industry. In the table below, we place our figures next to Promodo’s for the five industries that appear in both studies.
First Page Sage and Promodo Benchmarks in Matching Industries (2026)
| First Page Sage Industry | First Page Sage Median | First Page Sage 75th Percentile | Promodo Category | Promodo Average | Promodo Leader |
| Financial services & fintech | 5.4% | 11.7% | Finance | 4.8% | 11.9% |
| Fashion & apparel | 5.6% | 10.8% | Fashion: Clothing, Footwear & Accessories | 3.8% | 8.7% |
| Healthcare services & medical devices | 6.3% | 13.1% | Pharmacy & Healthcare | 3.9% | 9.8% |
| B2B SaaS & enterprise software | 6.1% | 12.8% | IT, SaaS & Marketing | 3.1% | 5.1% |
| Manufacturing & industrial products | 4.3% | 9.2% | B2B, Industry & Equipment | 2.6% | 9.3% |
Typical AI Share of Voice in Matching Industries: First Page Sage and Promodo
Our team took the following from the comparison:
- We found that both mention-share datasets place the typical company in the low to middle single digits. Promodo’s industry averages were 0.6 to 3.0 percentage points below our medians in the five matching industries. A likely reason is that share of voice falls as more brands are tracked in a category, and the number of brands tracked differs between the two datasets.
- Our data showed that leader benchmarks describe a different group of companies. Presenc AI and ThriveStack measured the best-known brands in each category, many of them with revenue well above $1 billion. Our own size data points the same way: median share of voice in our largest revenue band (10.2%) was nearly double the overall median (5.4%).
- We found that tier guidance based on the share of AI responses mentioning a brand runs higher than mention share for the same company. One AI response usually mentions several brands, so a company that appears in 15% of responses can hold a much smaller share of all mentions.
Taking the sources together, a company under $1 billion in revenue can treat a share of voice near 5% as typical, a share near 11% as strong, and a share in the middle teens or above as the level held by category leaders.
Study Composition
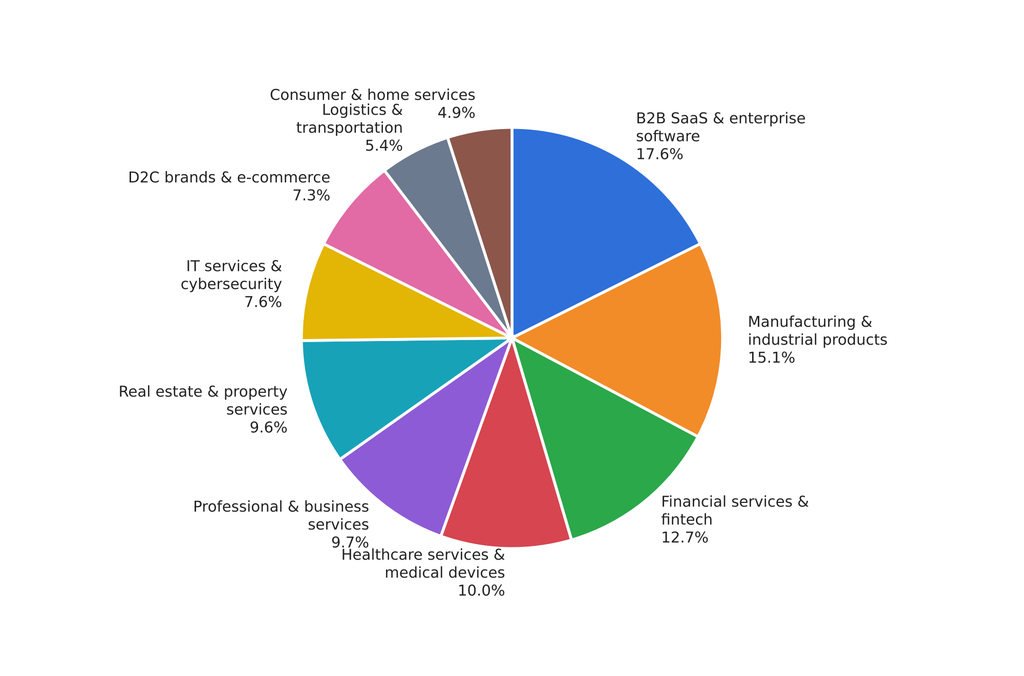
In the tables below, we show how the 647 companies in the study are distributed by industry and by annual revenue. Each company was evaluated as one brand.
Companies in the Study by Industry (2026)
| Industry | Companies | Share of Sample |
| B2B SaaS & enterprise software | 114 | 17.6% |
| Manufacturing & industrial products | 98 | 15.1% |
| Financial services & fintech | 82 | 12.7% |
| Healthcare services & medical devices | 65 | 10.0% |
| Professional & business services | 63 | 9.7% |
| Real estate & property services | 62 | 9.6% |
| IT services & cybersecurity | 49 | 7.6% |
| D2C brands & e-commerce | 47 | 7.3% |
| Logistics & transportation | 35 | 5.4% |
| Consumer & home services | 32 | 4.9% |
| Total | 647 | 100.0% |
Companies in the Study by Industry
Companies in the Study by Annual Revenue (2026)
| Annual Revenue | Companies | Share of Sample |
| Under $10 million | 131 | 20.2% |
| $10 million to under $50 million | 223 | 34.5% |
| $50 million to under $250 million | 195 | 30.1% |
| $250 million to $1 billion | 98 | 15.1% |
| Total | 647 | 100.0% |
Percentages may not sum to 100.0% due to rounding.
Our team took the following from the composition of the study:
- The three largest industry groups (B2B SaaS & enterprise software, manufacturing & industrial products, and financial services & fintech) account for 45.4% of the companies.
- Companies with $10 million to under $250 million in annual revenue make up 64.6% of the sample, so the overall benchmarks are most representative of the mid-market.
- No company in the study has more than $1 billion in annual revenue. Benchmarks for the largest brands in a category will run higher than the figures in this report.
Requesting a Copy of This Report
If you’d like to request a PDF copy of this report or learn more about our agency, you can reach out here.
- First Page Sage Research Study. First Page Sage. November 2026. San Francisco, California.
- GEO Benchmarks 2026: AI Visibility by Industry. Yanina Mishchuk, Promodo. July 16, 2026.
- LLM Share of Voice by Industry 2026. Ramanath, Presenc AI. May 2026.
- AI Visibility Benchmarks 2026: Empirical Study Across 100 SaaS Brands. ThriveStack. August 2026.
- Competitive AI Search Benchmarking. Matt Pru, Stackmatix. March 9, 2026.
- Brand Performance Reports. Semrush. 2026. Boston, Massachusetts.
- Brand Insights. Peec AI. 2026. Berlin, Germany.