Most companies set their marketing budget as a share of revenue, and the people who set it want to know how that share compares with companies of a similar size and industry. Published benchmarks on this question come mostly from surveys of large enterprises, so smaller private companies have less data to compare against.
Between July and November 2026, the First Page Sage research team surveyed 2,816 private small to midsize companies, each with annual revenue of $100 million or less, about their marketing spend in their most recently completed fiscal year. The study set out to answer one question: what percent of revenue do companies spend on marketing?
For this study, marketing spend includes paid advertising, the salaries of in-house marketing staff, agency and contractor fees, marketing software, content production, and events. It excludes sales team compensation. Each company reported its marketing spend and its revenue for the same fiscal year, and we divided the first figure by the second.
Summary of Findings
- The average company in our study spends 8.3% of its revenue on marketing. The median company spends 6.6%.
- Half of all companies spend between 3.5% and 11.3% of their revenue on marketing.
- D2C brands and consumer e-commerce companies spend the most at 16.8% of revenue, followed by B2B SaaS and enterprise software companies at 14.9%.
- Construction and commercial contracting companies spend the least at 2.4% of revenue.
- Companies with under $1 million in revenue spend 11.9% of it on marketing, nearly double the 6.2% spent by companies with $50 million to $100 million.
- In-house marketing staff (28.3%) and paid advertising (26.9%) together make up more than half of the average marketing budget.
Average Marketing Spend as a Percent of Revenue
The table below shows how much of their revenue the 2,816 companies in our study spend on marketing. We report both the average and the median because a small group of heavy spenders pulls the average up.
Average Marketing Spend as a Percent of Revenue (2026)
| Measure | Marketing Spend as a Percent of Revenue |
| Average | 8.3% |
| Median | 6.6% |
| 25th percentile | 3.5% |
| 75th percentile | 11.3% |
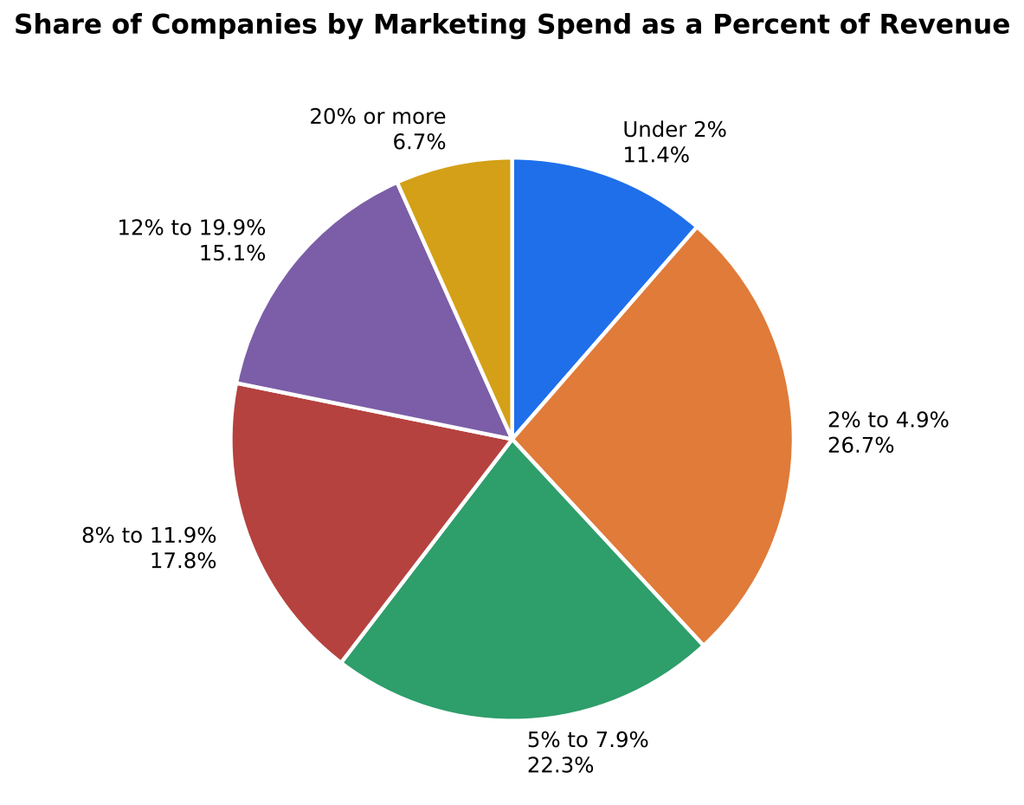
The chart below groups the same companies by the share of revenue they spend on marketing.
Our team took the following from this data:
- We found that the median of 6.6% is the more useful benchmark for most companies, because the 8.3% average is raised by the 6.7% of companies that spend 20% or more of their revenue on marketing.
- Our data showed that 38.1% of companies spend under 5% of their revenue on marketing, and 21.8% spend 12% or more.
- Our average of 8.3% falls between the two most cited enterprise benchmarks for 2026: 7.8% in Gartner’s CMO Spend Survey and 9.0% in The CMO Survey. For guidance on setting a budget by company lifecycle stage, see our breakdown of what percentage of revenue to allocate to marketing.
Marketing Spend as a Percent of Revenue by Industry
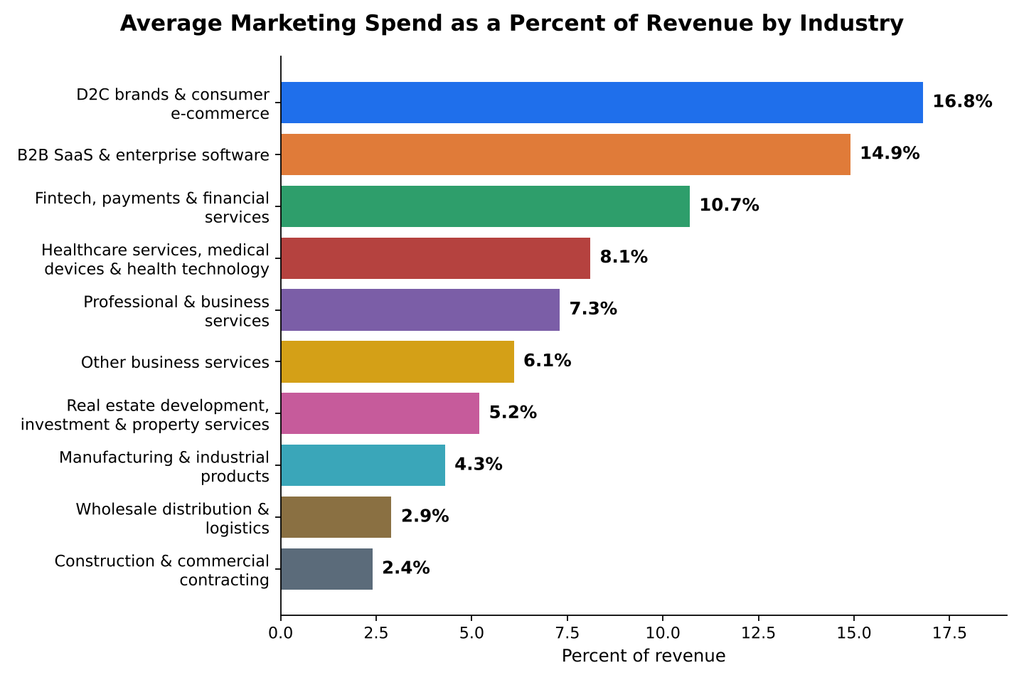
Industry is the largest factor in how much a company spends on marketing. In the table below, we break down average and median marketing spend for the 10 industries in our study, ordered from highest to lowest.
Marketing Spend as a Percent of Revenue by Industry (2026)
| Industry | Average | Median | Companies Surveyed |
| D2C brands & consumer e-commerce | 16.8% | 14.9% | 176 |
| B2B SaaS & enterprise software | 14.9% | 12.6% | 483 |
| Fintech, payments & financial services | 10.7% | 8.8% | 306 |
| Healthcare services, medical devices & health technology | 8.1% | 6.7% | 327 |
| Professional & business services | 7.3% | 6.0% | 218 |
| Other business services | 6.1% | 4.8% | 83 |
| Real estate development, investment & property services | 5.2% | 4.1% | 341 |
| Manufacturing & industrial products | 4.3% | 3.4% | 574 |
| Wholesale distribution & logistics | 2.9% | 2.3% | 191 |
| Construction & commercial contracting | 2.4% | 1.9% | 117 |
The chart below compares the average for each industry.
Our team took the following from this data:
- We found a sevenfold gap between the highest and lowest spending industries. D2C brands and consumer e-commerce companies spend 16.8% of their revenue on marketing, and construction and commercial contracting companies spend 2.4%.
- Our data showed that industries selling online to a large number of buyers spend the most. D2C, B2B SaaS, and fintech companies all average above 10% of revenue.
- We found that industries that win business through bids, long-term contracts, and existing relationships spend the least. Manufacturing, wholesale distribution, and construction companies all average below 5% of revenue.
Marketing Spend as a Percent of Revenue by Company Size
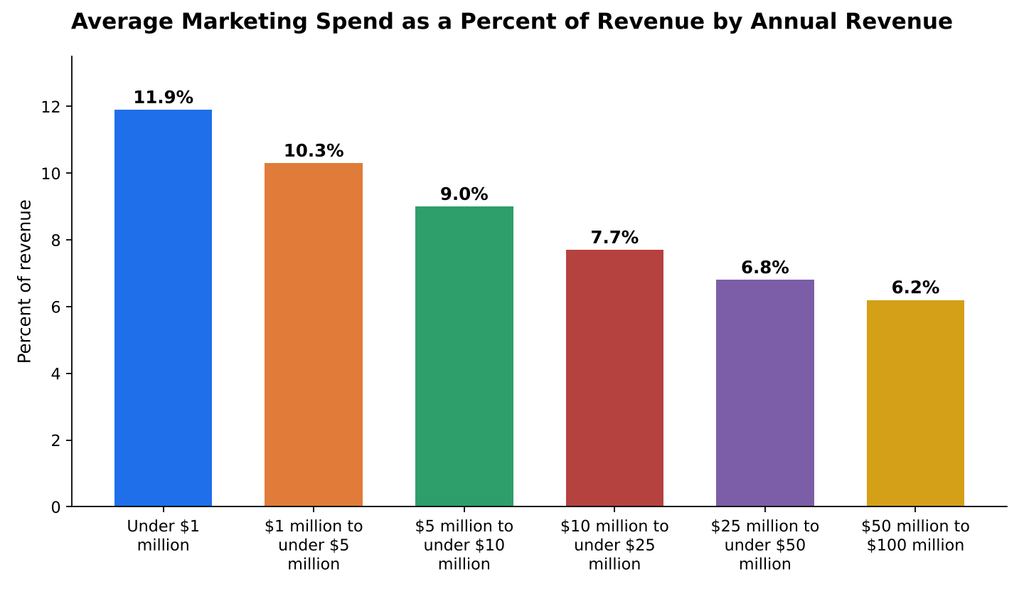
Company size also affects the figure. In the table below, we break down marketing spend by annual revenue, using each company’s most recently completed fiscal year.
Marketing Spend as a Percent of Revenue by Annual Revenue (2026)
| Annual Revenue | Average | Median | Companies Surveyed |
| Under $1 million | 11.9% | 9.2% | 143 |
| $1 million to under $5 million | 10.3% | 8.3% | 417 |
| $5 million to under $10 million | 9.0% | 7.2% | 648 |
| $10 million to under $25 million | 7.7% | 6.3% | 763 |
| $25 million to under $50 million | 6.8% | 5.5% | 536 |
| $50 million to $100 million | 6.2% | 4.9% | 309 |
The chart below shows how the average changes as revenue grows.
Our team took the following from this data:
- We found that marketing spend as a percent of revenue falls with each step up in company size, from 11.9% for companies with under $1 million in revenue to 6.2% for companies with $50 million to $100 million.
- Our data showed that smaller companies spend a larger share because basic marketing costs, such as a website, a first marketing hire, and software, take up more of a small revenue base.
- In dollar terms, larger companies still spend far more. A company with $75 million in revenue spending 6.2% puts about $4.65 million a year into marketing, compared with about $71,000 for a company with $600,000 in revenue spending 11.9%.
How Companies Allocate Their Marketing Budgets
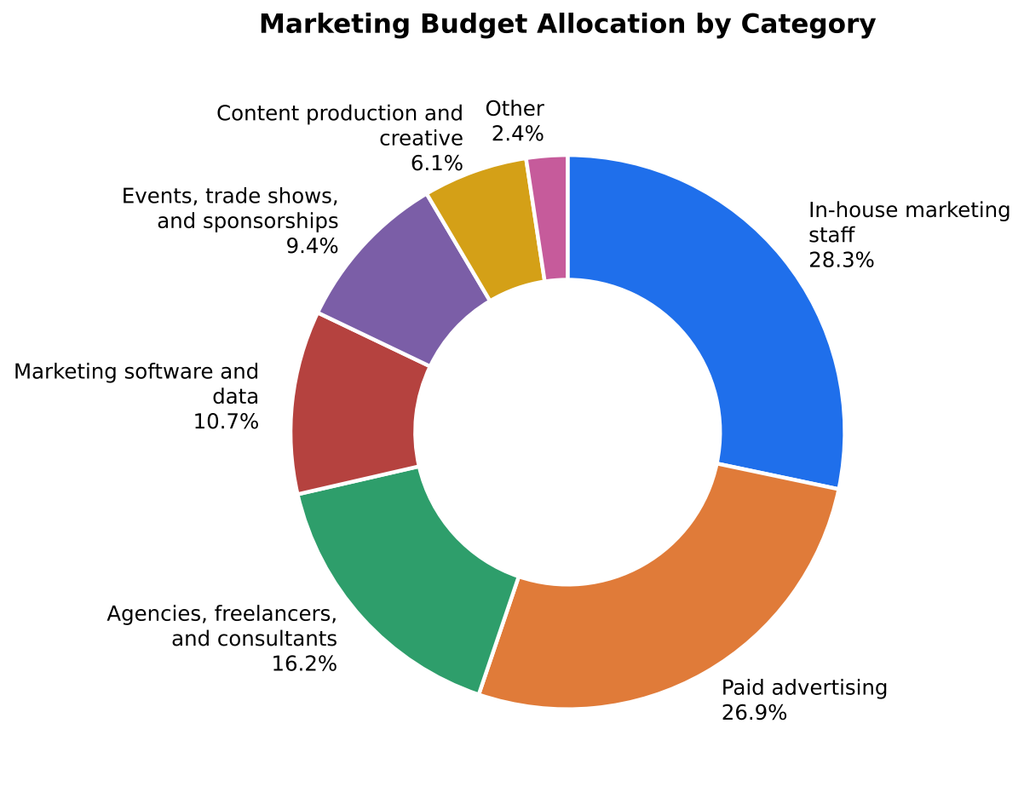
We also asked each company how its marketing budget is divided. The table below shows the average share of the marketing budget that goes to each category.
Marketing Budget Allocation by Category (2026)
| Category | Share of Marketing Budget |
| In-house marketing staff | 28.3% |
| Paid advertising | 26.9% |
| Agencies, freelancers, and consultants | 16.2% |
| Marketing software and data | 10.7% |
| Events, trade shows, and sponsorships | 9.4% |
| Content production and creative | 6.1% |
| Other | 2.4% |
The chart below shows the same allocation.
Our team took the following from this data:
- We found that people and advertising are the two largest costs. In-house marketing staff and paid advertising together make up 55.2% of the average marketing budget.
- Our data showed that companies spend 16.2% of their marketing budgets on agencies, freelancers, and consultants.
- Marketing software and data account for 10.7% of the average budget, ahead of events, trade shows, and sponsorships at 9.4%. For benchmarks on the return from each marketing channel, see our Digital Marketing Statistics Compendium.
Companies Included in This Study
All 2,816 companies in the study are privately held and reported annual revenue of $100 million or less. The two tables below show the companies by primary industry and by annual revenue.
Companies Surveyed by Primary Industry (2026)
| Primary Industry | Companies | Share |
| Manufacturing & industrial products | 574 | 20.4% |
| B2B SaaS & enterprise software | 483 | 17.2% |
| Real estate development, investment & property services | 341 | 12.1% |
| Healthcare services, medical devices & health technology | 327 | 11.6% |
| Fintech, payments & financial services | 306 | 10.9% |
| Professional & business services | 218 | 7.7% |
| Wholesale distribution & logistics | 191 | 6.8% |
| D2C brands & consumer e-commerce | 176 | 6.3% |
| Construction & commercial contracting | 117 | 4.2% |
| Other business services | 83 | 2.9% |
| Total | 2,816 | 100%* |
*Shares add up to 100.1% because of rounding.
Companies Surveyed by Annual Revenue (2026)
| Annual Revenue | Companies | Share |
| Under $1 million | 143 | 5.1% |
| $1 million to under $5 million | 417 | 14.8% |
| $5 million to under $10 million | 648 | 23.0% |
| $10 million to under $25 million | 763 | 27.1% |
| $25 million to under $50 million | 536 | 19.0% |
| $50 million to $100 million | 309 | 11.0% |
| Total | 2,816 | 100% |
Our team took the following from this data:
- Manufacturing and industrial products companies are the largest group at 20.4% of the study, followed by B2B SaaS and enterprise software companies at 17.2%.
- Companies with $5 million to under $25 million in annual revenue account for 50.1% of the study.
- Our results are most useful as a benchmark for private companies with revenue of $100 million or less. Surveys of large public companies cover a different group and report different figures.
Requesting a Copy of This Report
If you’d like to request a PDF copy of this report or learn more about our agency, you can reach out here.
- First Page Sage Research Study. First Page Sage. November 2026. San Francisco, California.
- Gartner 2026 CMO Spend Survey. Gartner. May 2026. London, United Kingdom.
- The CMO Survey: 2026 Results. Christine Moorman, Duke University Fuqua School of Business. March 2026. Durham, North Carolina.
- CMOs Face Headwinds Even as Marketing Value and AI Impact Grow. Duke University Fuqua School of Business. 2026. Durham, North Carolina.
- Marketing and Sales. U.S. Small Business Administration. October 2026. Washington, D.C.