Between September 2 and September 29, 2026, our research team ran 4,182 prompts through seven of the most widely used AI platforms to measure how often each one presents false information as fact. For this study, we define a hallucination as any factual claim in a response that is fabricated, contradicted by an authoritative source, or attributed to a source that does not support it. Opinions, predictions, and errors of style or grammar were excluded.
Prompts were drawn from nine topic areas and seven query types, and each was submitted in the platform’s default consumer setting. Two reviewers graded every response against primary sources, and a third reviewer resolved disagreements. We report results at two levels: the share of responses that contained at least one hallucination, and the share of individual factual claims that were false. The first figure reflects how often a typical user receives a flawed answer. The second reflects how much of a flawed answer is still reliable.
In the sections below, we break down AI hallucination rates by platform, over time, by topic area, by query type, and by response setting.
AI Hallucination Rates by Platform
In the table below, we rank the seven platforms in our study by the share of their responses that contained at least one hallucination. Platforms were selected based on their share of U.S. usage, which we track in our generative AI chatbot market share report.
AI Hallucination Rates by Platform (September 2026)
| Rank | AI Platform | Response Hallucination Rate | Claim-Level Hallucination Rate | Citation Error Rate | Declined to Answer |
| 1 | Claude | 8.7% | 2.1% | 6.4% | 11.8% |
| 2 | ChatGPT | 11.4% | 2.9% | 9.7% | 6.3% |
| 3 | Google Gemini (including AI Mode in Google Search) | 13.9% | 3.4% | 11.2% | 5.1% |
| 4 | Microsoft Copilot | 14.6% | 3.7% | 12.8% | 4.6% |
| 5 | Grok | 17.3% | 4.6% | 18.9% | 2.7% |
| 6 | Meta AI | 21.8% | 5.8% | 23.4% | 3.2% |
| 7 | DeepSeek | 24.6% | 6.7% | 27.1% | 1.9% |
Our researchers took three main findings from this data:
- We found that Claude had the lowest response-level hallucination rate at 8.7%, while DeepSeek had the highest at 24.6%, a gap of nearly three to one.
- Platforms that declined to answer more often hallucinated less. Claude declined 11.8% of prompts and DeepSeek declined 1.9%, and the willingness to decline tracked closely with accuracy across all seven platforms.
- On the three lowest-ranked platforms, the citation error rate was higher than the overall hallucination rate, meaning a cited source was more likely to be wrong than the answer itself.
AI Hallucination Rates Over Time, Q1 2024 to Q3 2026
We have run a smaller version of this study every quarter since the first quarter of 2024, using a fixed core set of 600 prompts so that results are comparable from one wave to the next. In the table below, we show the quarterly rates for ChatGPT, Claude, and Google Gemini, along with the average across every platform tracked in each wave. The Q3 2026 figures come from the full September study.
Quarterly AI Hallucination Rates by Platform
| Quarter | ChatGPT | Claude | Google Gemini | All-Platform Average |
| Q1 2024 | 27.3% | 24.8% | 33.6% | 31.7% |
| Q2 2024 | 26.1% | 23.6% | 31.9% | 30.4% |
| Q3 2024 | 23.4% | 21.9% | 29.2% | 28.6% |
| Q4 2024 | 23.9% | 20.4% | 27.4% | 27.1% |
| Q1 2025 | 21.2% | 18.7% | 24.8% | 25.4% |
| Q2 2025 | 19.6% | 18.1% | 25.3% | 24.7% |
| Q3 2025 | 18.8% | 15.6% | 21.7% | 22.3% |
| Q4 2025 | 16.3% | 13.4% | 19.1% | 20.8% |
| Q1 2026 | 15.1% | 12.7% | 17.6% | 18.9% |
| Q2 2026 | 12.8% | 10.3% | 15.2% | 17.6% |
| Q3 2026 | 11.4% | 8.7% | 13.9% | 16.0% |
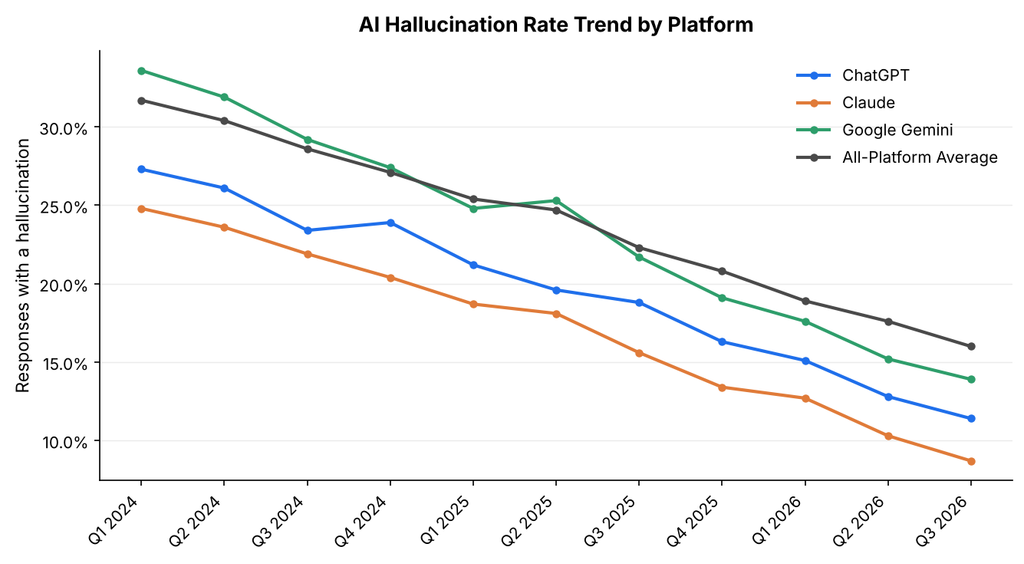
Across the 11 quarters, the all-platform average fell from 31.7% to 16.0%, a decline of roughly half. The decline was uneven. ChatGPT’s rate rose in Q4 2024 and Gemini’s rose in Q2 2025, and in both cases we traced the increase to new models that attempted a larger share of difficult prompts instead of declining them. This pattern appears repeatedly in our data: improvements in answer rate tend to arrive a quarter or two ahead of improvements in accuracy.
AI Hallucination Rates by Topic Area
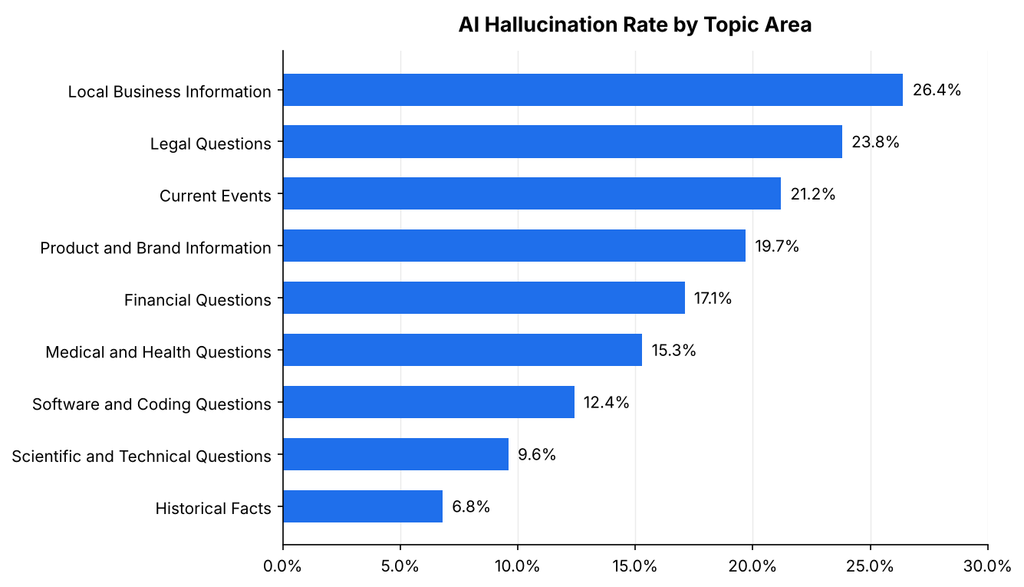
Hallucination rates varied more by subject than by platform. In the table below, we break down the response-level hallucination rate for each of the nine topic areas in our prompt set, along with the error our reviewers recorded most often in each one.
AI Hallucination Rates by Topic Area (September 2026)
| Topic Area | Response Hallucination Rate | Most Common Error |
| Local Business Information | 26.4% | Outdated hours, addresses, and closures |
| Legal Questions | 23.8% | Invented case law and statutes |
| Current Events | 21.2% | Conflated or outdated events |
| Product and Brand Information | 19.7% | Invented features and pricing |
| Financial Questions | 17.1% | Outdated rates and figures |
| Medical and Health Questions | 15.3% | Outdated or misapplied guidance |
| Software and Coding Questions | 12.4% | Invented functions and packages |
| Scientific and Technical Questions | 9.6% | Misattributed research findings |
| Historical Facts | 6.8% | Incorrect dates and figures |
Our researchers took three main findings from this data:
- We found that topics where facts change often, including local business details, current events, and pricing, produced hallucinations at three to four times the rate of stable topics such as historical facts.
- Product and brand information was wrong in about one in five responses. The most common errors were features a product never had and prices that were outdated or invented. We found these errors were most frequent when a brand’s details differed between its own website and third-party sources, which is the problem generative engine optimization is designed to address.
- Legal questions ranked second overall, and most legal errors involved cases or statutes that do not exist, which is consistent with earlier academic research on legal hallucinations.
AI Hallucination Rates by Query Type
The way a question is asked has a large effect on whether the answer contains a hallucination. In the table below, we compare seven query types and show each one’s risk relative to a simple factual lookup.
AI Hallucination Rates by Query Type (September 2026)
| Query Type | Response Hallucination Rate | Risk Relative to Simple Factual Lookups |
| Summaries of Provided Documents | 4.3% | 0.6x |
| Simple Factual Lookups | 7.2% | 1.0x |
| Multi-Step Reasoning Questions | 14.8% | 2.1x |
| Requests for Statistics or Figures | 22.6% | 3.1x |
| Requests for Citations or Sources | 27.9% | 3.9x |
| Questions About Niche Topics | 31.4% | 4.4x |
| Questions Containing a False Premise | 46.7% | 6.5x |
Our researchers took three main findings from this data:
- We found that questions containing a false premise produced the highest hallucination rate at 46.7%. In most of these cases, the platform accepted the false premise and built its answer on top of it.
- Requests for statistics and citations were three to four times more likely to produce a hallucination than simple lookups, which makes them the riskiest query types for researchers and journalists.
- Summarizing a document the user provided was the most reliable task we tested, with a hallucination rate of 4.3%.
AI Hallucination Rates by Response Setting
We re-ran a 1,100-prompt subset under four alternative settings to measure how much each one changes the result. These settings carry more weight as AI platforms take on multi-step tasks for users, a trend we cover in our agentic AI statistics report. In the table below, we compare each setting to the platforms’ default behavior.
AI Hallucination Rates by Response Setting (September 2026)
| Response Setting | Response Hallucination Rate | Citation Error Rate | Change From Default Mode |
| Default Mode | 16.0% | 15.6% | None |
| Web Retrieval | 10.9% | 9.3% | -31.9% |
| Extended Reasoning | 13.2% | 14.1% | -17.5% |
| Web Retrieval With Extended Reasoning | 8.6% | 7.8% | -46.3% |
| Uncertainty Instruction | 11.7% | 12.4% | -26.9% |
Our researchers took three main findings from this data:
- We found that web retrieval reduced the hallucination rate by about a third, the largest effect of any single setting.
- Extended reasoning reduced hallucinations by 17.5% but had little effect on citation errors, which fell only from 15.6% to 14.1%.
- Combining web retrieval with extended reasoning cut the hallucination rate nearly in half, to 8.6%, and a one-sentence instruction asking the platform to flag uncertainty reduced it by 26.9%.
Requesting a Copy of This Report
If you’d like to request a PDF copy of this report or learn more about our agency, you can reach out here.
- First Page Sage Research Study. First Page Sage, September 2026. San Francisco, California
- Hallucination Leaderboard, Vectara, May 2026, Palo Alto, California
- Why Language Models Hallucinate, OpenAI, September 2025, San Francisco, California
- AI Search Has a Citation Problem, Tow Center for Digital Journalism, Columbia Journalism Review, March 2025, New York, New York
- AI on Trial: Legal Models Hallucinate in 1 out of 6 (or More) Benchmarking Queries, Stanford Institute for Human-Centered Artificial Intelligence, May 2024, Stanford, California
- Multi-Model Assurance Analysis Showing Large Language Models Are Highly Vulnerable to Adversarial Hallucination Attacks During Clinical Decision Support, Communications Medicine (Icahn School of Medicine at Mount Sinai), August 2025, New York, New York