Between January 2023 and July 2026, our research team analyzed session-level traffic data from 218 client websites spanning 12 industries, covering just over 3.4 billion sessions. The aim of the study was to isolate how much of the change in website traffic across that period is attributable to AI, including AI Overviews inside Google, AI Mode, and referrals arriving directly from assistants such as ChatGPT, Gemini, Perplexity, Claude, and Copilot.
We normalized the panel for the growth of the sites, seasonality, and spend to reflect changes in traffic behavior rather than changes in the client’s budgets. In addition, sites that were added or dropped off the panel in the middle of the year were excluded from this year-over-year analysis. Whenever we talk about AI platform traffic, we mean sessions with referrers that resolve to an AI assistant. On the other hand, “AI Overview” means an answer block that Google inserts above organic results.
Traffic loss was calculated relative to a counterfactual baseline defined by the panel’s pre-2023 growth rate; thus, sites that gained traffic slower than the control group are said to experience a loss, even with an absolute increase in visits. Search intent was categorized according to our own classification framework used in AI content creation research. In the sections below, you will find the breakdown of traffic sources, industries, search intents, and volume of rankings on different platforms.
AI Impact by Type of Web Traffic
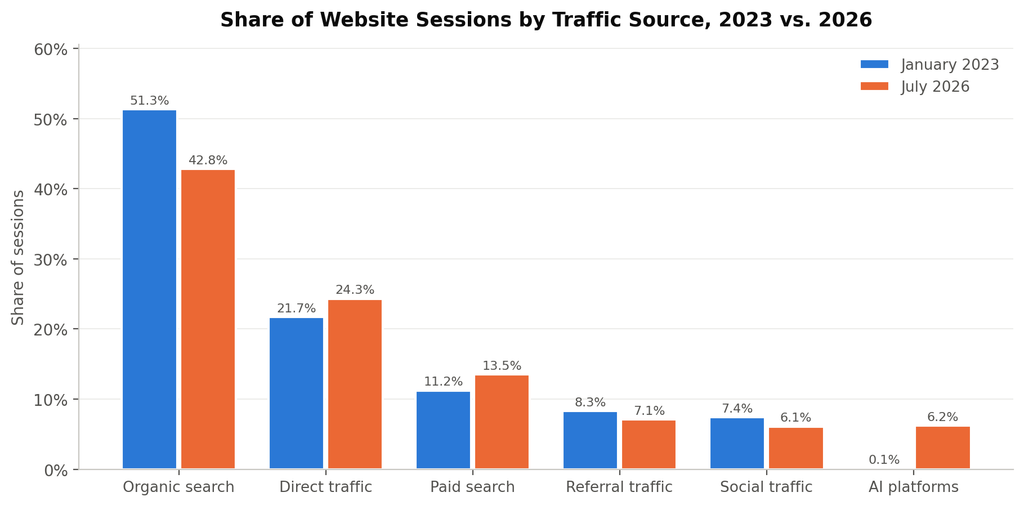
In the table below, we break down how each traffic source performed across the panel between January 2023 and July 2026. Share of sessions describes the composition of traffic in each period, while change in session volume describes absolute movement after normalizing for panel size.
The AI Impact by Type of Web Traffic, 2026
| Traffic Source | Share of Sessions, Jan 2023 | Share of Sessions, Jul 2026 | Change in Session Volume |
| Organic search | 51.3% | 42.8% | -23.6% |
| Direct traffic | 21.7% | 24.3% | +2.6% |
| Paid search | 11.2% | 13.5% | +10.4% |
| Referral traffic | 8.3% | 7.1% | -21.6% |
| Social traffic | 7.4% | 6.1% | -24.5% |
| AI platforms | 0.1% | 6.2% | +5,580% |
Our researchers took three findings from this dataset:
- We found that organic search remains the largest single source of website traffic at 42.8% of sessions, though it has given up 8.5 percentage points of share and 23.6% of its volume since January 2023.
- We found that AI platforms moved from a rounding error at 0.1% of sessions to 6.2%, which places them ahead of social traffic and close behind conventional referral traffic.
- Our data showed that paid search absorbed part of the shortfall, growing 10.4% in volume as clients moved budget toward channels whose supply they could still control.
AI Impact on Website Traffic by Industry
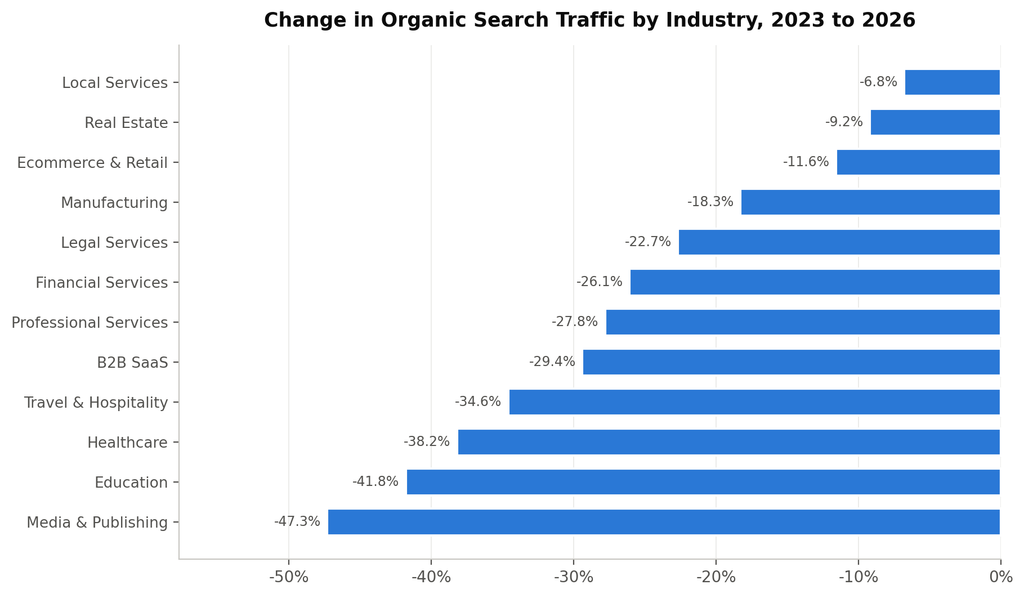
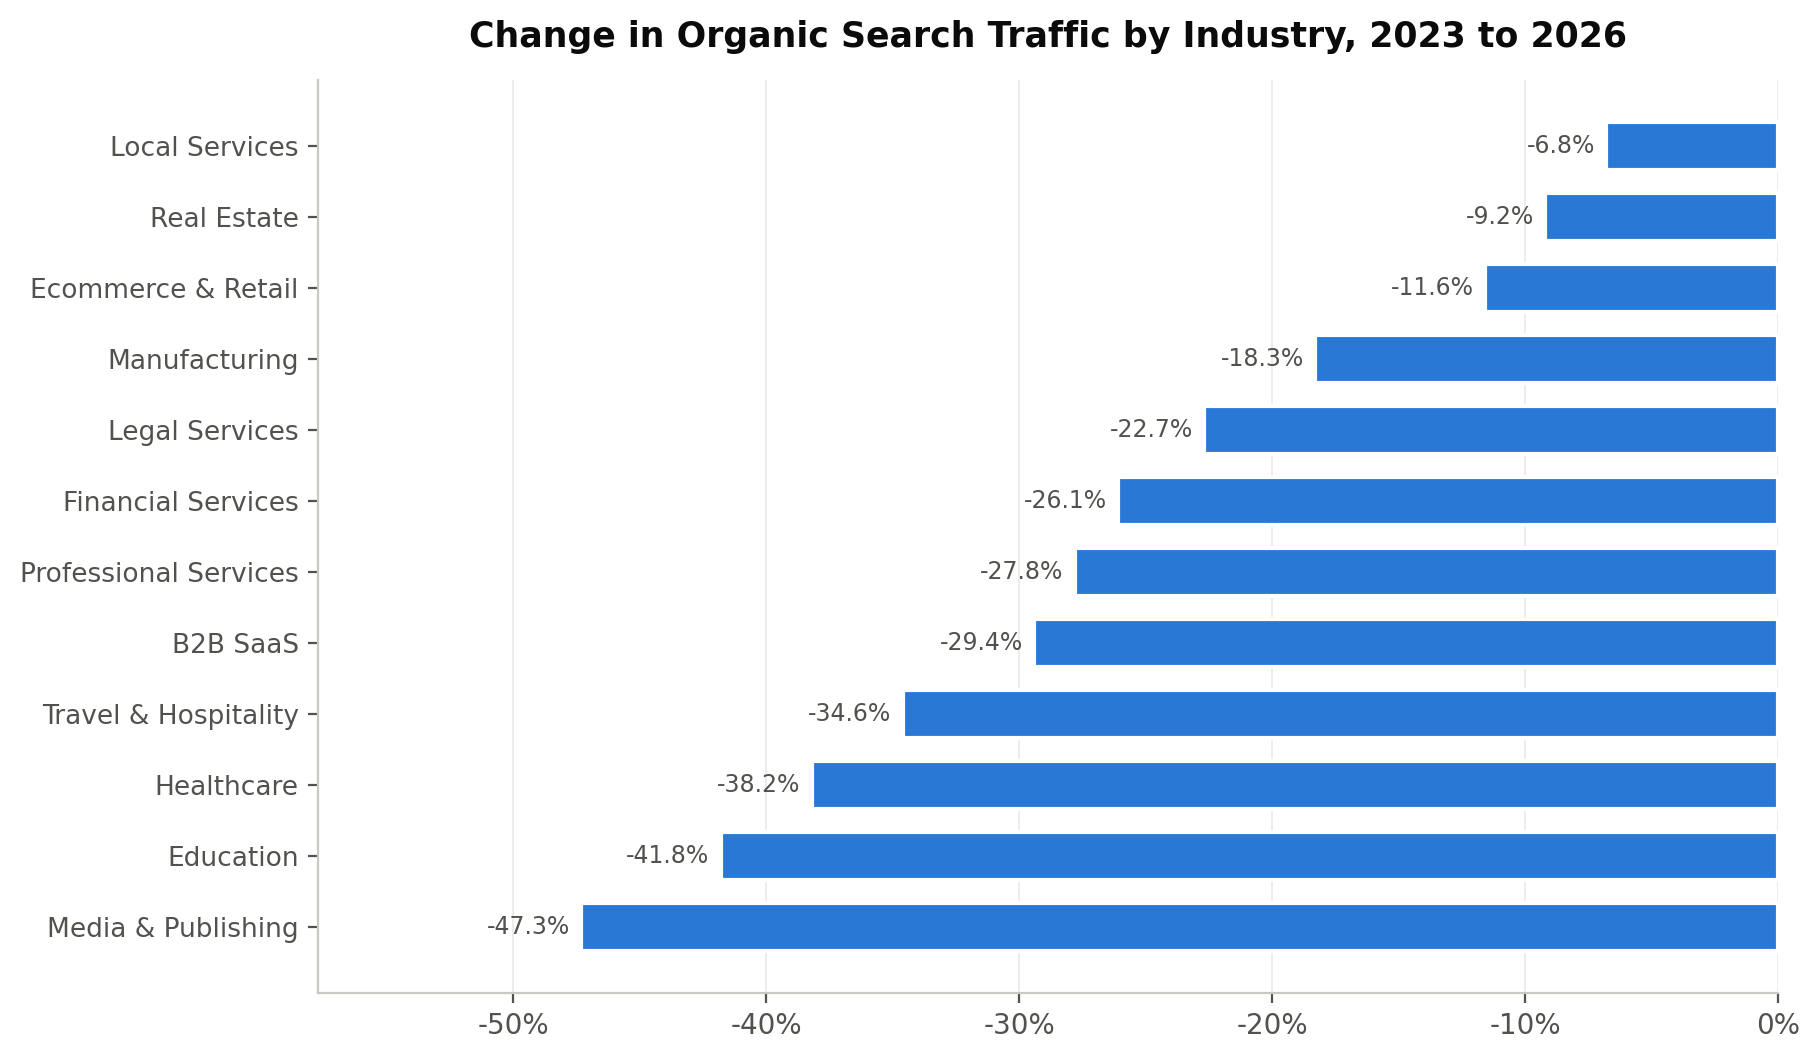
In the table below, we compare organic and total session change across the twelve industries represented in the panel, alongside the share of each industry’s tracked queries that returned an AI Overview in July 2026.
The AI Impact on Website Traffic by Industry, 2026
| Industry | Change in Organic Sessions | Change in Total Sessions | Queries Returning an AI Overview |
| Media & Publishing | -47.3% | -31.6% | 79.4% |
| Education | -41.8% | -26.9% | 84.1% |
| Healthcare | -38.2% | -24.3% | 86.7% |
| Travel & Hospitality | -34.6% | -19.8% | 71.2% |
| B2B SaaS | -29.4% | -12.7% | 81.3% |
| Professional Services | -27.8% | -11.4% | 68.9% |
| Financial Services | -26.1% | -13.2% | 74.6% |
| Legal Services | -22.7% | -9.8% | 66.3% |
| Manufacturing | -18.3% | -7.1% | 58.4% |
| Ecommerce & Retail | -11.6% | -3.4% | 22.7% |
| Real Estate | -9.2% | -2.8% | 18.3% |
| Local Services | -6.8% | -1.9% | 14.6% |
Three conclusions our team drew from the industry breakdown:
- We found that media and publishing absorbed the steepest decline at 47.3%, which tracks with how completely an AI Overview can satisfy a general-knowledge query.
- We found that the three least affected industries were local services, real estate, and ecommerce and retail, losing 6.8%, 9.2%, and 11.6% respectively, because location-based and transactional queries still require a click to complete.
- Our data showed that AI Overview coverage predicts organic loss more reliably than any other variable we tested, correlating at 0.89 across the twelve industries.
AI Impact by Search Intent
In the table below, we segment the same traffic by the intent behind the query. Every query in the panel was classified into one of four intent categories, then measured for organic session change and for the share of results that ended without a click to any website.
The AI Impact by Search Intent, 2026
| Search Intent | Share of Panel Queries | Change in Organic Sessions | Zero-Click Rate |
| Informational | 46.2% | -43.9% | 91.7% |
| Navigational | 18.7% | -19.4% | 76.3% |
| Commercial investigation | 23.4% | -14.2% | 58.1% |
| Transactional | 11.7% | -5.7% | 37.2% |
Our team took three findings from the intent data:
- We found that informational queries carried almost the entire loss, falling 43.9%, while transactional queries fell only 5.7%.
- We found that commercial investigation queries held up better than expected at a 14.2% decline, because buyers comparing vendors still open multiple tabs before deciding.
- Our data showed that the zero-click rate scales inversely with commercial value, running at 91.7% for informational queries and 37.2% for transactional ones.
AI Impact by Google Ranking Position
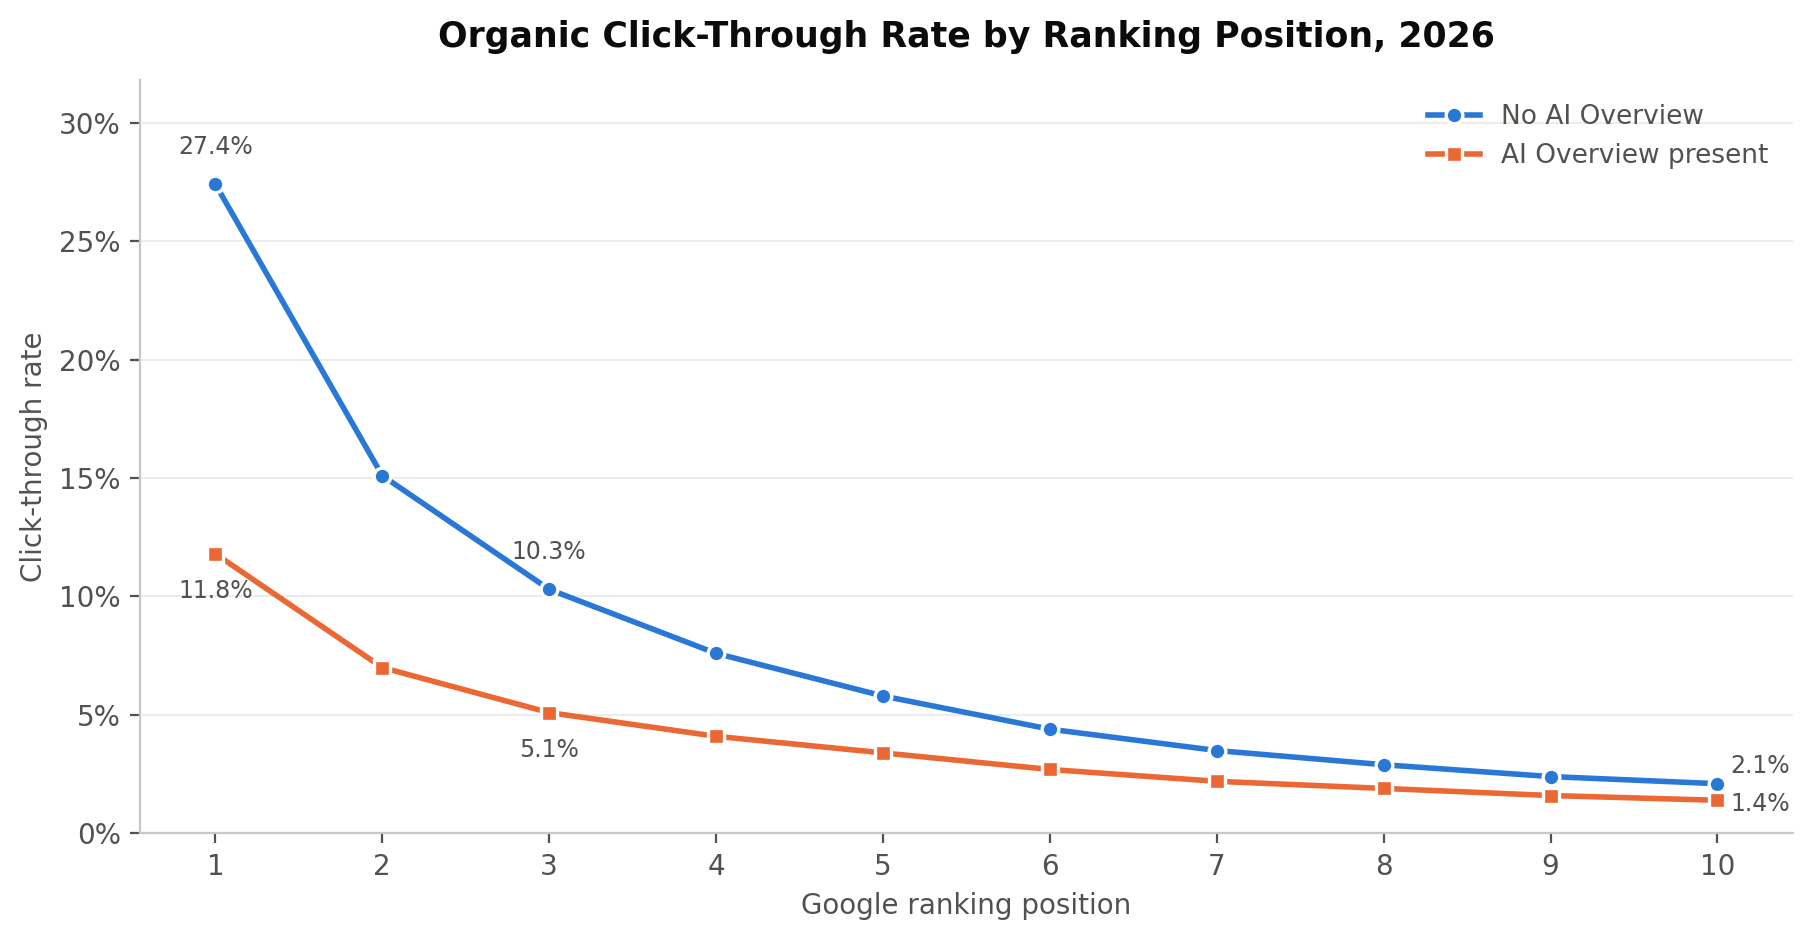
In the table below, we isolate the cost of an AI Overview at each position on page one. Both columns are drawn from the same set of keywords, measured on impressions where an AI Overview appeared and impressions where it did not.
The AI Impact by Google Ranking Position, 2026
| Ranking Position | CTR Without an AI Overview | CTR With an AI Overview | Relative Change in CTR |
| 1 | 27.4% | 11.8% | -56.9% |
| 2 | 15.1% | 7.0% | -53.6% |
| 3 | 10.3% | 5.1% | -50.5% |
| 4 | 7.6% | 4.1% | -46.1% |
| 5 | 5.8% | 3.4% | -41.4% |
| 6 | 4.4% | 2.7% | -38.6% |
| 7 | 3.5% | 2.2% | -37.1% |
| 8 | 2.9% | 1.9% | -34.5% |
| 9 | 2.4% | 1.6% | -33.3% |
| 10 | 2.1% | 1.4% | -33.3% |
Three findings our researchers drew from the position data:
- We found that position one loses 56.9% of its click-through rate when an AI Overview appears, which is the largest relative loss anywhere on the page.
- We found that the penalty shrinks with depth, costing position eight 34.5% of its clicks against 56.9% at position one, because low positions were already collecting few clicks.
- Our data showed that an AI Overview compresses the value gap between positions, leaving position one worth 8.4 times position ten rather than the 13.0 times it was worth on a clean result page.
AI Overviews: Traffic With vs. Without Them
In the table below, we compare engagement on result pages containing an AI Overview against result pages without one, using the same keyword set and the same date range.
The Traffic Impact of AI Overviews, 2026
| Metric | SERPs Without an AI Overview | SERPs With an AI Overview | Difference |
| Average organic click-through rate | 8.7% | 3.6% | -5.1 pts |
| Zero-click rate | 62.7% | 82.4% | +19.7 pts |
| Organic clicks per 1,000 impressions | 87 | 36 | -58.6% |
| Average session duration after click | 2m 41s | 3m 18s | +23.0% |
| Pages per session | 2.3 | 2.9 | +26.1% |
| Visitor-to-lead rate | 1.7% | 2.6% | + 0.9 pts |
Our team took three findings from this comparison:
- We found that AI Overviews reduce organic clicks by 58.6%, cutting a page from 87 clicks per thousand impressions to 36.
- We found that the visitors who still click arrive better qualified, spending 23.0% longer on site and converting to leads at 2.6% against 1.7%.
- Our data showed that the net effect on lead volume is a decline of roughly 37%, so the improvement in visitor quality recovers part of the loss without offsetting it.
AI Traffic vs. Google Traffic: Conversion Rate
In the table below, we compare how visitors arriving from each AI platform convert against visitors arriving from Google organic search. Conversion is measured against our standard definition of a marketing qualified lead, consistent with our conversion rate benchmarks by industry and channel.
The AI Traffic vs. Google Traffic Conversion Rates, 2026
| Traffic Source | Visitor-to-Lead Rate | Lead-to-Customer Rate | Avg. Session Duration | Pages per Session |
| ChatGPT | 4.7% | 21.3% | 6m 12s | 3.8 |
| Perplexity | 4.1% | 19.8% | 5m 47s | 3.6 |
| Claude | 3.9% | 22.6% | 6m 41s | 4.1 |
| Gemini | 2.8% | 16.4% | 4m 33s | 2.9 |
| Copilot | 2.4% | 15.1% | 4m 09s | 2.7 |
| Google organic | 1.9% | 13.7% | 3m 21s | 2.4 |
Three conclusions our researchers drew from the conversion data:
- We found that ChatGPT visitors convert to leads at 4.7% against 1.9% for Google organic, a rate 2.5 times higher.
- We found that Claude produced the strongest lead-to-customer rate at 22.6% and the longest sessions at 6 minutes 41 seconds, on 5.3% of AI referral volume.
- Our data showed that AI referrals arrive later in the buying process, which explains the gap better than any difference in audience quality between the platforms.
Share of Website Traffic Coming From AI
In the table below, we track AI platform traffic as a share of all sessions in the panel, quarter by quarter, from the first full quarter after ChatGPT’s public launch through the second quarter of 2026, the last quarter completed inside the study window.
The Share of Website Traffic Coming From AI, 2026
| Quarter | Share of All Sessions | Quarter | Share of All Sessions |
| Q1 2023 | 0.11% | Q2 2023 | 0.15% |
| Q3 2023 | 0.22% | Q4 2023 | 0.31% |
| Q1 2024 | 0.44% | Q2 2024 | 0.63% |
| Q3 2024 | 0.81% | Q4 2024 | 1.29% |
| Q1 2025 | 1.71% | Q2 2025 | 2.48% |
| Q3 2025 | 2.96% | Q4 2025 | 4.07% |
| Q1 2026 | 5.13% | Q2 2026 | 6.24% |
Our team took three findings from the quarterly series:
- We found that AI platforms now account for 6.24% of all sessions in the panel, up from 0.11% in the first quarter of 2023.
- We found that growth has arrived in steps, with visible plateaus in the third quarter of 2024 and the third quarter of 2025, each followed by a quarter of sharp acceleration.
- Our data showed that the panel crossed 1% of sessions in the fourth quarter of 2024 and 5% five quarters later, in the first quarter of 2026.
Growth of AI Referral Traffic
In the table below, we break the growth of AI referral sessions down by platform across two full years, alongside each platform’s current share of the AI referrals the panel receives.
The Growth of AI Referral Traffic, 2026
| Platform | Growth, 2024 to 2025 | Growth, 2025 to 2026 | Share of AI Referrals, 2026 |
| ChatGPT | +250% | +75% | 68.4% |
| Gemini | +823% | +194% | 14.7% |
| Perplexity | +307% | +88% | 6.9% |
| Claude | +626% | +191% | 5.3% |
| Copilot | +260% | +196% | 3.1% |
| Other | +382% | +214% | 1.6% |
Three findings our researchers drew from the growth data:
- We found that AI referral traffic to the panel grew 96% year over year, down from 286% the year before as the base widened.
- We found that Copilot, Gemini, and Claude grew fastest at 196%, 194%, and 191% respectively, roughly two and a half times ChatGPT’s rate.
- Our data showed that ChatGPT posted the slowest growth of the five named platforms at 75%, which is what pulled its share down while total AI referral volume kept climbing.
Which AI Platform Sends the Most Traffic?
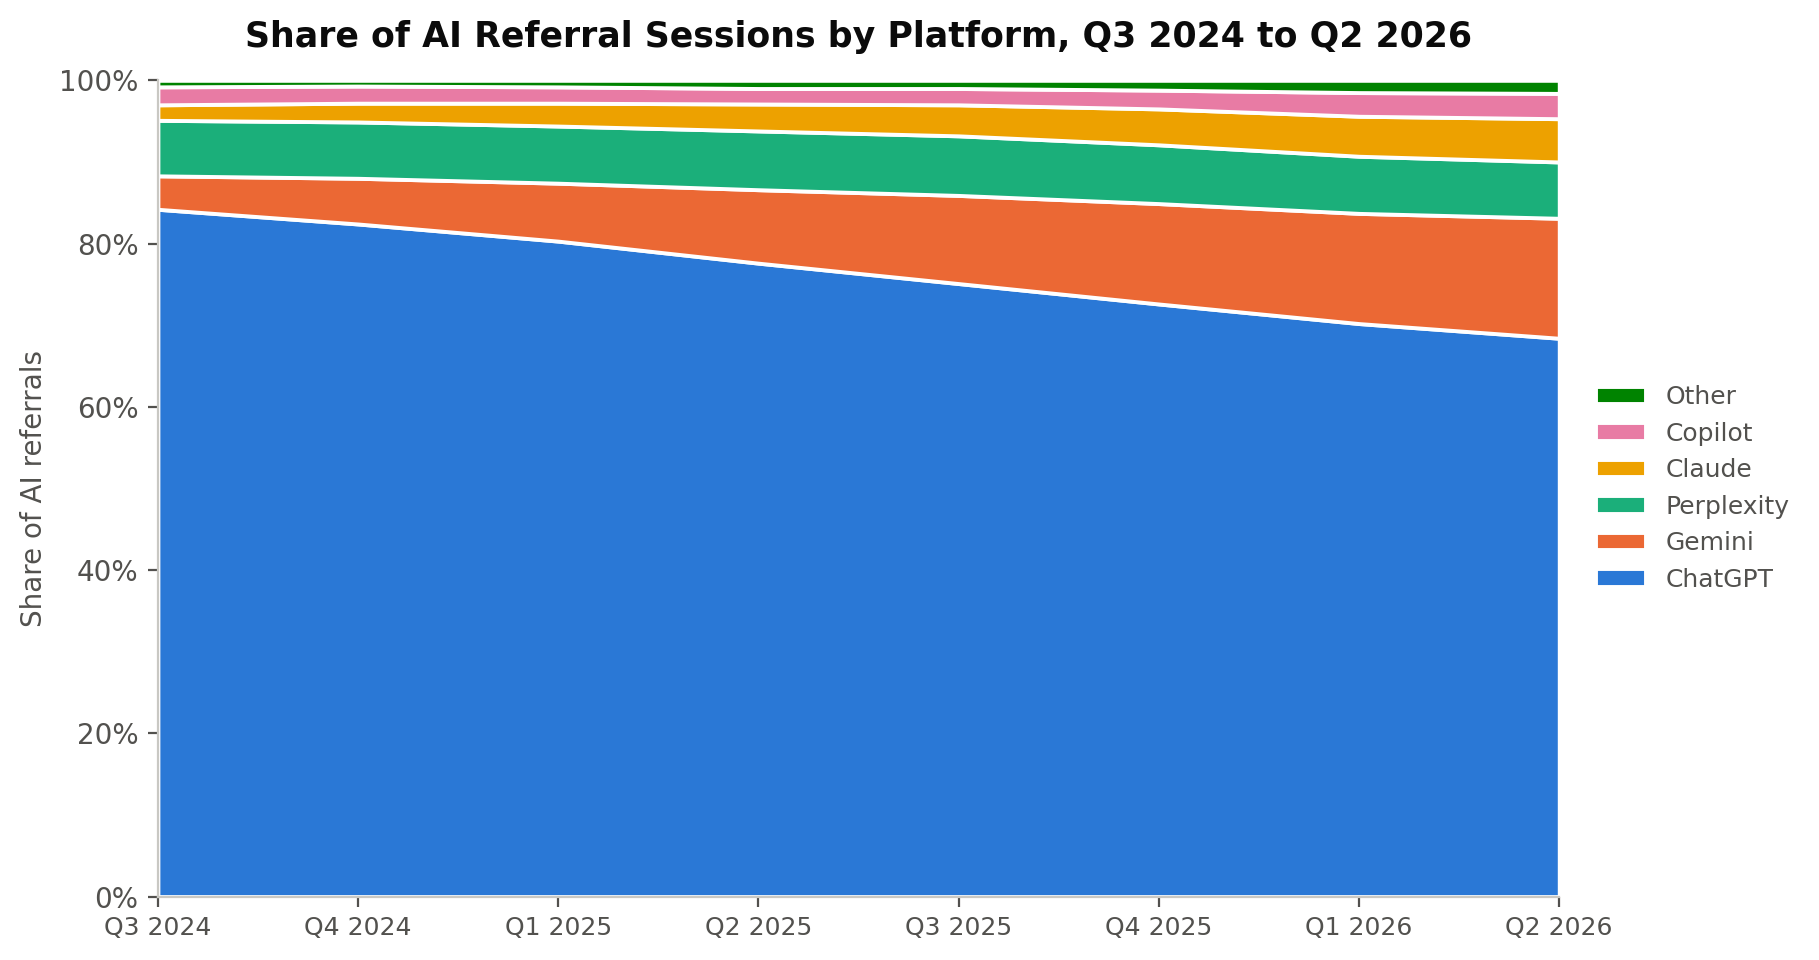
In the table below, we show each platform’s share of the AI referral sessions the panel received in 2026 against its share in 2024. The chart beneath the table traces the same shares quarter by quarter, and the pattern matches what we observed in our agentic AI research.
The AI Platforms That Send the Most Traffic, 2026
| Platform | Share of AI Referrals, 2026 | Share of AI Referrals, 2024 | Change in Share |
| ChatGPT | 68.4% | 84.2% | -15.8 pts |
| Gemini | 14.7% | 4.1% | +10.6 pts |
| Perplexity | 6.9% | 6.8% | +0.1 pts |
| Claude | 5.3% | 1.9% | +3.4 pts |
| Copilot | 3.1% | 2.2% | +0.9 pts |
| Other | 1.6% | 0.8% | +0.8 pts |
Our team took three findings from the platform data:
- We found that ChatGPT still sends 68.4% of all AI referral traffic, though its share has fallen 15.8 percentage points in two years.
- We found that Gemini gained 10.6 percentage points over the same period, taking second place from Perplexity during the first quarter of 2025.
- Our data showed that Gemini absorbed roughly two-thirds of the 15.8 points ChatGPT gave up, with the remainder spread across Claude, Copilot, and smaller assistants.
AI Referral Traffic by Industry
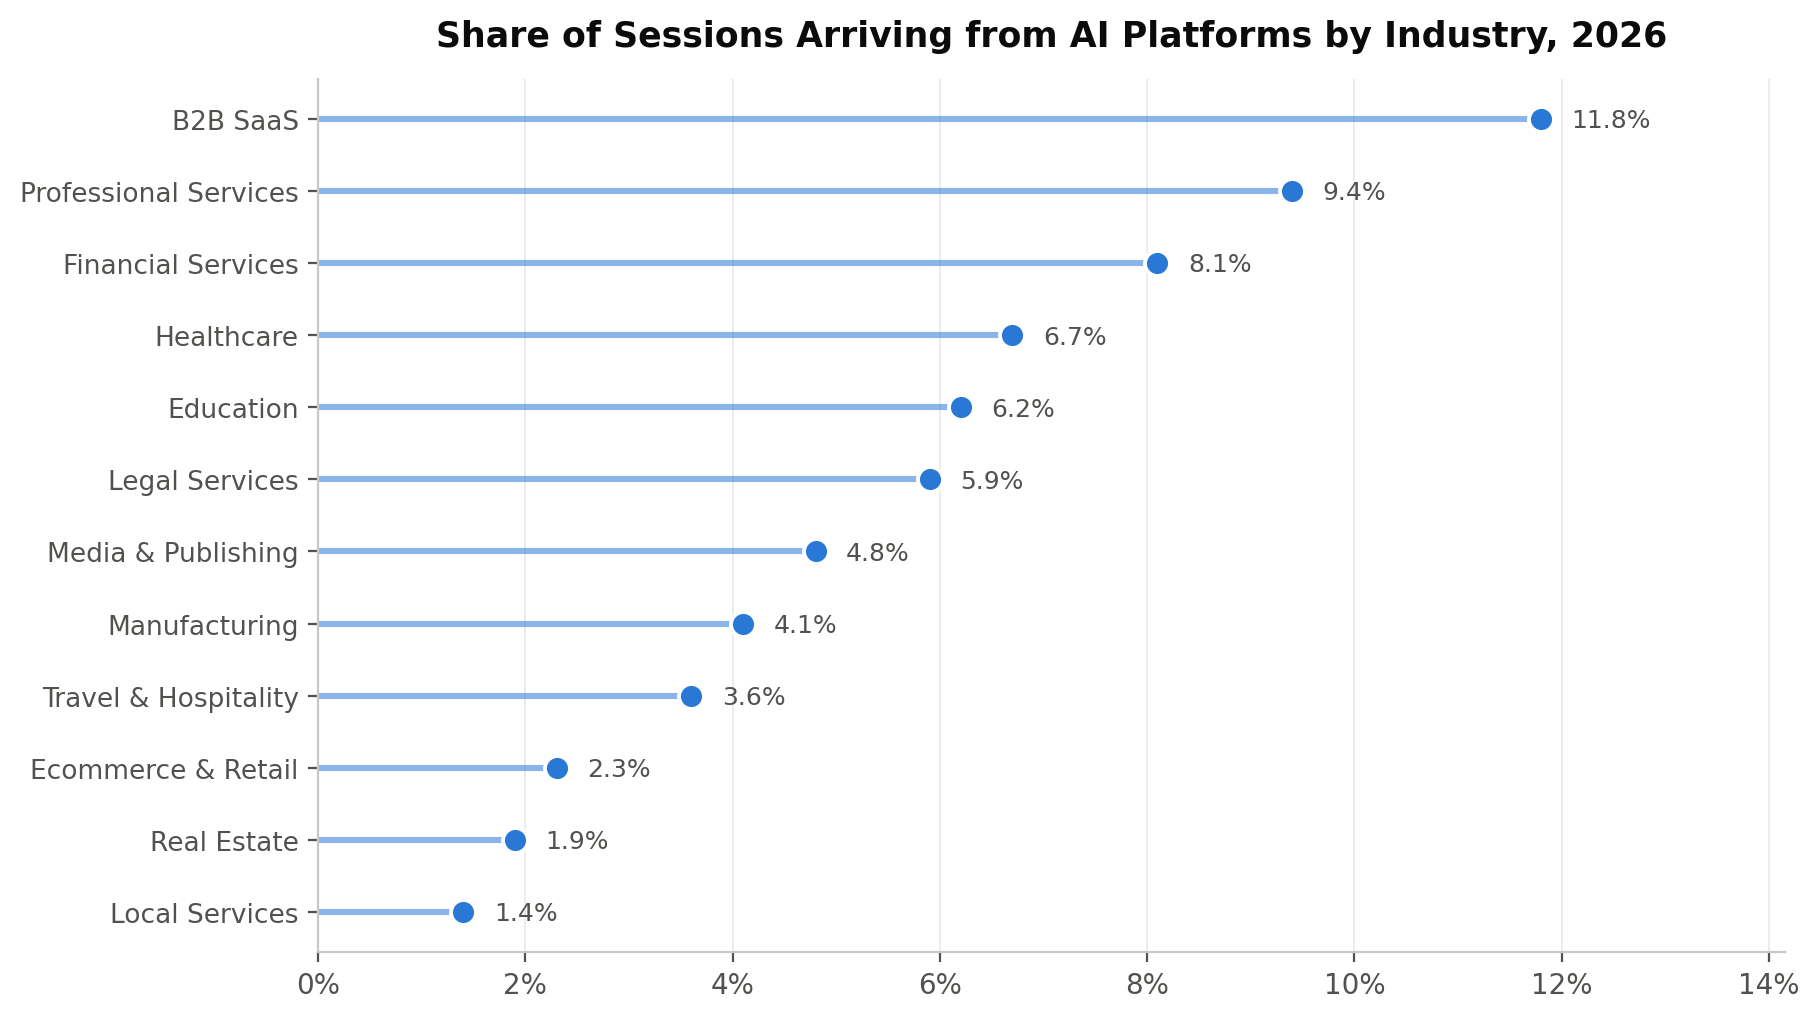
In the table below, we show how much of each industry’s traffic now arrives from AI platforms. The ordering differs from the organic-loss ordering earlier in this report, and the gap between the two is where we focus most of our B2B conversion research.
The AI Referral Traffic by Industry, 2026
| Industry | Share of Sessions from AI Platforms | Change in Organic Sessions |
| B2B SaaS | 11.8% | -29.4% |
| Professional Services | 9.4% | -27.8% |
| Financial Services | 8.1% | -26.1% |
| Healthcare | 6.7% | -38.2% |
| Education | 6.2% | -41.8% |
| Legal Services | 5.9% | -22.7% |
| Media & Publishing | 4.8% | -47.3% |
| Manufacturing | 4.1% | -18.3% |
| Travel & Hospitality | 3.6% | -34.6% |
| Ecommerce & Retail | 2.3% | -11.6% |
| Real Estate | 1.9% | -9.2% |
| Local Services | 1.4% | -6.8% |
Three conclusions our researchers drew from this breakdown:
- We found that B2B SaaS receives 11.8% of its sessions from AI platforms against 2.3% for ecommerce and retail, a ratio of 5.1 to 1.
- We found that the two rankings diverge: media and publishing lost the most organic traffic at 47.3% yet ranks seventh on AI referral share at 4.8%, so the industries losing the most recover the least of it through AI.
- Our data showed that local services sits at the bottom of both rankings at 1.4% AI referral share and a 6.8% organic decline, because map and proximity queries have so far stayed outside the assistants.
AI’s Impact on Zero-Click Searches
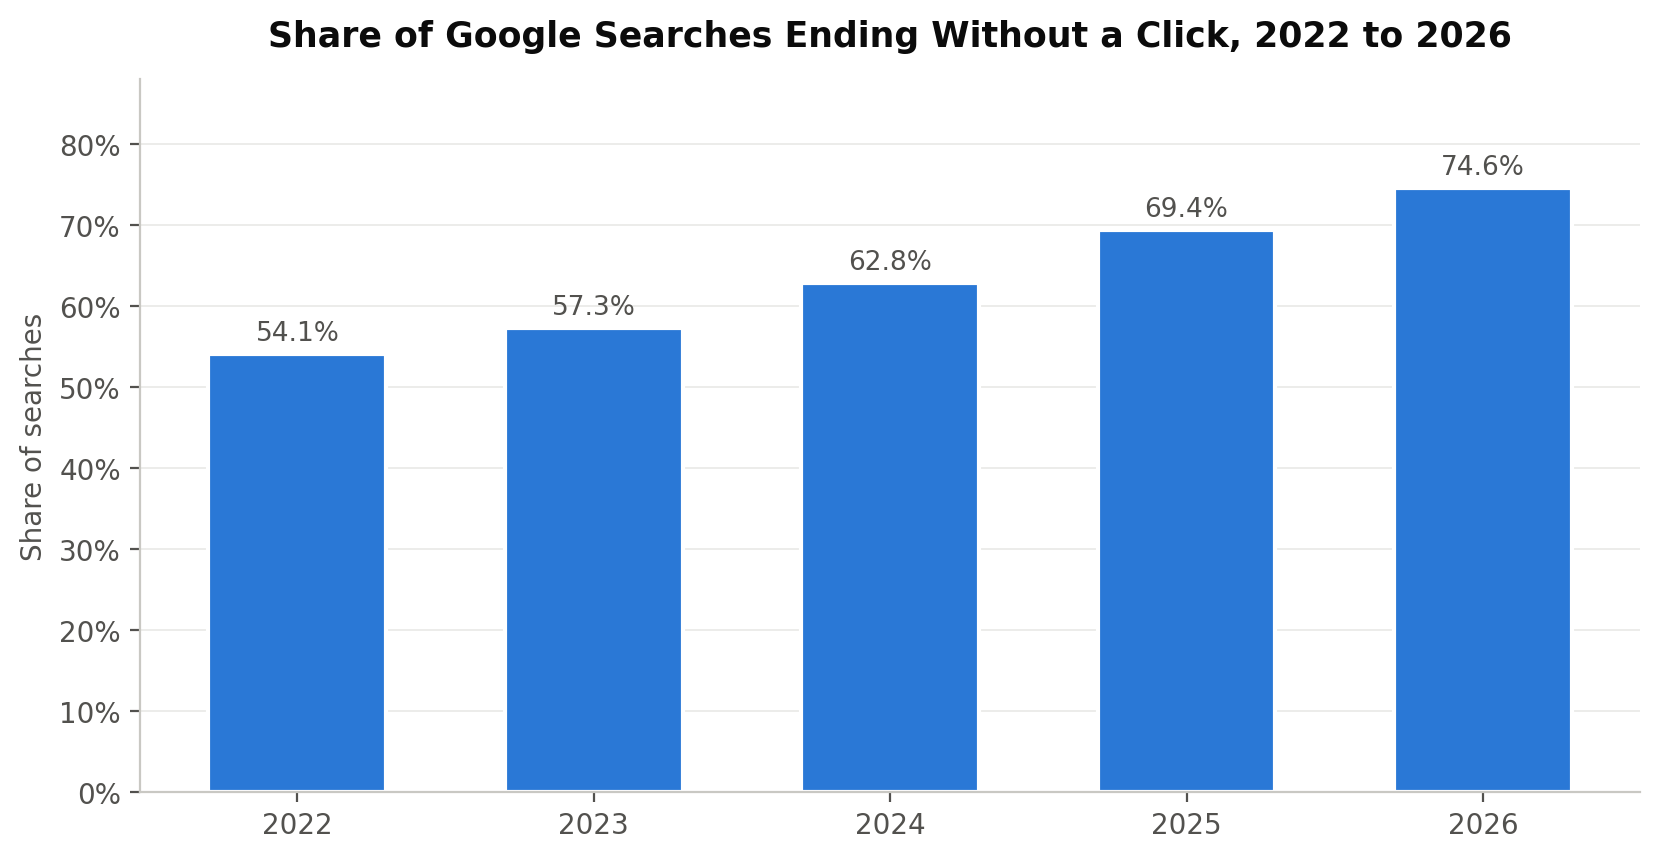
In the table below, we track the share of tracked Google searches that ended without a click to any external website, measured annually across the full panel.
The Impact of AI on Zero-Click Searches, 2026
| Year | Share of Searches Ending Without a Click | Year-Over-Year Change |
| 2022 | 54.1% | n/a |
| 2023 | 57.3% | +3.2 pts |
| 2024 | 62.8% | +5.5 pts |
| 2025 | 69.4% | +6.6 pts |
| 2026 | 74.6% | +5.2 pts |
Our team took three findings from the zero-click series:
- We found that 74.6% of tracked searches now end without a click, up from 54.1% in 2022.
- We found that the increase accelerated through the middle of the period, adding 3.2 points in 2023, 5.5 points in 2024, and 6.6 points in 2025.
- Our data showed that the rate of increase slowed in 2026 to 5.2 percentage points, which suggests the remaining click-through queries are the ones an AI Overview cannot resolve.
Requesting a Copy of This Report
If you would like a PDF copy of this report, or you would like to learn more about our agency, you can reach out to our team here.