Our research team spent the third quarter of 2026, from July 13 through September 30, measuring how people use Grok, the AI assistant built by xAI. The dataset combines web and app panel data covering grok.com and the Grok mobile app, usage data for the Grok features built into X, a survey of 1,860 Grok users in the U.S., the U.K. and India, and a classified sample of 286,000 anonymized prompts. We modeled and normalized these inputs so that each person counts once, however many ways they reach Grok.
Grok differs from most AI assistants in where people find it. Hundreds of millions of people see it inside X, where it answers questions about posts and live events, while others use it through its own app and website or in Tesla vehicles. In the sections below, we break down Grok’s user base, its growth since early 2025, the ways people reach it, where its users live, and what they ask it to do.
Summary of Findings
- Grok reached 117.6 million monthly active users in September 2026, up 3.0% from the prior quarter.
- Grok holds a 3.4% share of U.S. AI chatbot usage, behind ChatGPT, Google Gemini (including AI Mode in Google Search) and Claude.
- Monthly users peaked in Q1 2026 at 119.4 million, fell in the second quarter and partly recovered in the third.
- 46.8% of Grok users reach it mainly through X, making X its largest entry point.
- Real-time news and fact-checking posts on X make up 31.0% of all Grok prompts.
Grok Usage Overview
The table below gathers the core usage figures for Grok at the end of our study period, covering every way people use it: on X, in the Grok app, on grok.com and in Tesla vehicles.
Grok Usage Overview (September 2026)
| Metric | Figure |
| Monthly active users, all access points | 117.6 million |
| Quarter-over-quarter growth in monthly active users | 3.0% |
| U.S. AI chatbot market share | 3.4% |
| Monthly visits to grok.com | 286 million |
| Share of monthly X users who also use Grok | 22.6% |
| Paid SuperGrok subscribers | 2.3 million |
| Average session length | 7 minutes, 21 seconds |
| Share of Grok users who are male | 74.8% |
Our team took three main points from this data:
- We found that Grok’s 3.4% share of U.S. AI chatbot usage places it fourth, behind ChatGPT, Google Gemini (including AI Mode in Google Search) and Claude, and well ahead of Microsoft Copilot.
- Our data showed that only about 2% of monthly users pay for SuperGrok. Most people use the free tier, much of it through X, which keeps Grok’s audience large but its paying base small.
- Grok’s audience is far more male than that of other major assistants. Our survey found the gap widest among users who reach Grok mainly through X.
Grok Monthly Active Users, Q1 2025 to Q3 2026
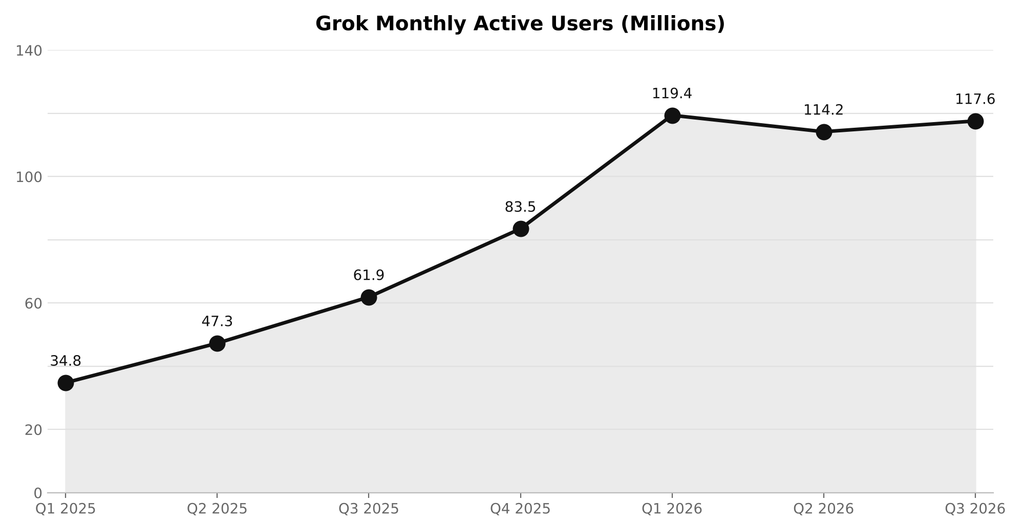
Grok’s user base has grown in bursts, usually after a new model release or feature launch. The table below shows our estimate of Grok’s monthly active users in the final month of each quarter, followed by a graph of the same data.
Grok Monthly Active Users by Quarter
| Quarter | Monthly Active Users | Change vs. Prior Quarter |
| Q1 2025 | 34.8 million | N/A |
| Q2 2025 | 47.3 million | +35.9% |
| Q3 2025 | 61.9 million | +30.9% |
| Q4 2025 | 83.5 million | +34.9% |
| Q1 2026 | 119.4 million | +43.0% |
| Q2 2026 | 114.2 million | -4.4% |
| Q3 2026 | 117.6 million | +3.0% |
Our researchers drew three conclusions from the trend:
- Grok grew more than threefold from 34.8 million users in the first quarter of 2025 to 119.4 million in the first quarter of 2026, with the largest gains following the Grok 3 and Grok 4 releases.
- Users fell 4.4% in the second quarter of 2026, the only decline in our dataset. App downloads dropped sharply after a surge in January, and many of the users who arrived then did not stay.
- The third quarter brought a 3.0% recovery to 117.6 million, which still leaves Grok below its peak.
Grok Monthly Active Users by Access Point
People reach Grok in four main ways. To avoid counting anyone twice, our model assigns each user to the access point they used most often during the month. The table below shows the result, followed by a chart of each access point’s share.
Grok Monthly Active Users by Access Point (September 2026)
| Access Point | Monthly Active Users | Share of Grok Users | Change vs. Prior Quarter | Average Sessions per User per Week |
| Grok on X | 55.0 million | 46.8% | -1.5% | 4.6 |
| Grok mobile app | 33.3 million | 28.3% | +11.3% | 5.9 |
| Grok.com | 25.6 million | 21.8% | +2.5% | 3.8 |
| Grok in Tesla vehicles | 3.6 million | 3.1% | +7.2% | 2.7 |
| All access points | 117.6 million | 100% | +3.0% | 4.7 |
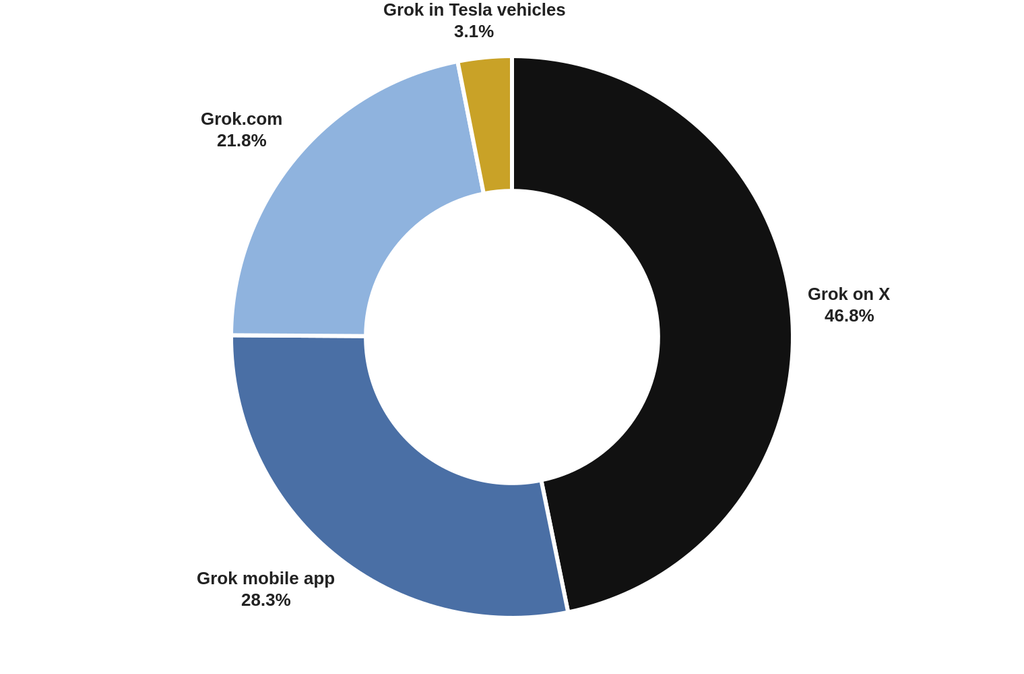
Three findings stood out to our team:
- X remains Grok’s largest entry point at 46.8% of users, but it was the only access point to lose users during the quarter, down 1.5%.
- The Grok mobile app grew fastest, up 11.3%, and its users opened Grok 5.9 times a week on average, more than users of any other access point.
- Grok in Tesla vehicles is small at 3.1% of users, but it is the only access point where most use happens by voice.
Grok Users by Country
Grok’s audience is more international than its American origins suggest. The table below shows the ten countries with the largest share of Grok’s monthly users, along with the share of each country’s monthly X users who also use Grok.
Grok Users by Country (September 2026)
| Country | Share of Grok Users | Share of X Users Who Also Use Grok |
| United States | 20.7% | 31.4% |
| India | 11.3% | 18.2% |
| Brazil | 4.9% | 21.7% |
| Indonesia | 3.8% | 16.9% |
| Vietnam | 3.6% | 24.8% |
| United Kingdom | 3.4% | 22.3% |
| Japan | 3.1% | 13.6% |
| Philippines | 2.7% | 19.5% |
| Turkey | 2.6% | 17.1% |
| Mexico | 2.4% | 15.8% |
| All other countries | 41.5% | N/A |
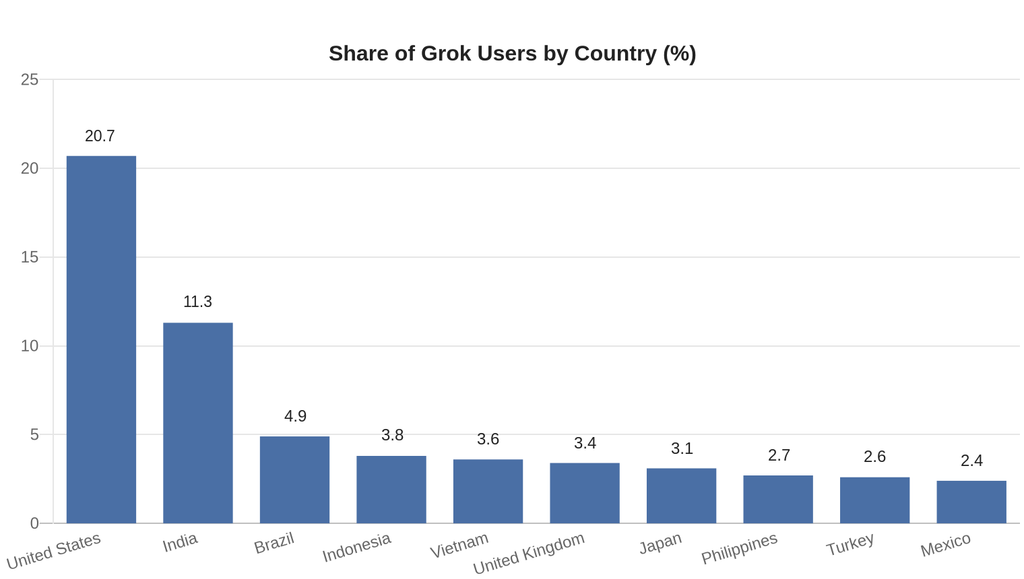
Our team found three patterns in the country data:
- The United States accounts for 20.7% of Grok users, but the ten largest countries together make up only 58.5%. Grok’s audience is spread across many mid-sized markets.
- India is Grok’s second-largest market at 11.3% of users, driven mostly by questions asked in replies on X, often in Hindi and other regional languages.
- The United States also has the highest share of X users who use Grok, at 31.4%, followed by Vietnam at 24.8%.
How People Use Grok
We classified our sample of 286,000 anonymized prompts into eight task types. The table below shows each task’s share of prompts and the access point where it happens most often, followed by a chart of the same breakdown.
Grok Prompts by Task Type (September 2026)
| Task Type | Share of Prompts | Access Point Where It Happens Most |
| Real-time news and current events | 19.4% | Grok on X |
| General questions and research | 17.2% | Grok.com |
| Image and video generation | 15.8% | Grok mobile app |
| Fact-checking posts on X | 11.6% | Grok on X |
| Entertainment and companion conversations | 10.2% | Grok mobile app |
| Writing and editing | 9.3% | Grok.com |
| Personal advice | 8.4% | Grok mobile app |
| Writing and debugging code | 8.1% | Grok.com |
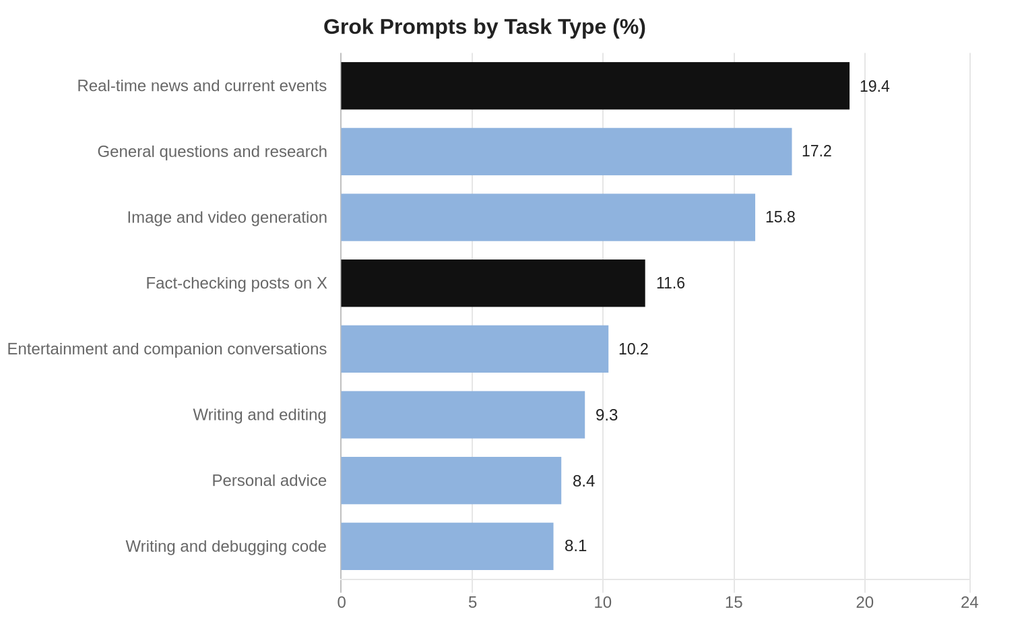
Here is what our researchers took from the breakdown:
- Real-time news and fact-checking posts on X together make up 31.0% of prompts, a far larger share of news-related use than we have measured for any other major assistant, including in our ChatGPT usage statistics.
- Image and video generation accounts for 15.8% of prompts, mostly in the Grok mobile app, where it is the single most common task.
- Coding makes up 8.1% of prompts, the smallest share of the eight task types. Developers in our survey said they use Grok for quick questions but rely on other tools for most programming work.
Requesting a Copy of This Report
If you’d like to request a PDF copy of this report or learn more about our agency, you can reach out here.
- First Page Sage Research Study. First Page Sage. September 2026. San Francisco, California.
- SpaceX: Grok Reaches 117 Million Users As AI Push Accelerates. Amit Chowdhry, Pulse 2.0. May 27, 2026. Ann Arbor, Michigan.
- Grok Downloads Crash 60% as Musk Rents AI Infrastructure to Rival Anthropic. Damilare Odedina, Techloy. May 12, 2026. United Kingdom.
- Grok Is Gaining on ChatGPT and Gemini. How It Got There Isn’t Pretty. Alex Kantrowitz, Big Technology. February 13, 2026. New York, New York.