Last updated November 6, 2026
After more than 15 years of comparing the two channels, our team found that SEO converts at a weighted average of 2.5% across all industries, while PPC converts at 1.4%. That average is of limited use on its own, because rates vary widely by industry: manufacturing and distribution companies convert at 3.2% through SEO, while higher education institutions convert at 1.5%.
The following report was compiled from client data and research from August 2022 through November 2026, covering 124 clients. Our sample skews B2B, and eCommerce is heavily represented among our B2C clients. Below, we share conversion rates by industry, the largest gaps between the two channels, and what those gaps mean for your marketing budget.
SEO vs. PPC Conversion Rates by Industry
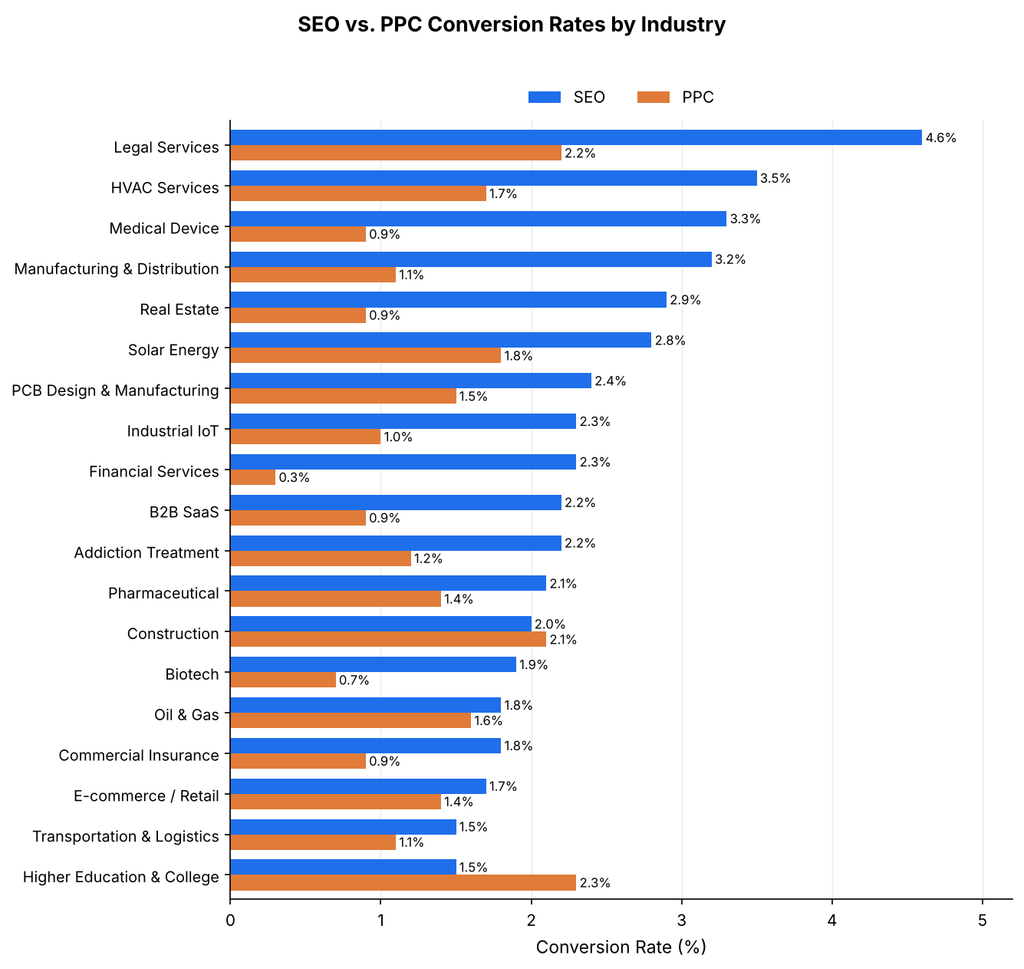
In the table below, we show the average SEO and PPC conversion rate for each of the 19 industries in our dataset, along with SEO’s rate as a multiple of PPC’s.
SEO vs. PPC Conversion Rates by Industry, 2026
| Industry | SEO Conversion Rate | PPC Conversion Rate | SEO-to-PPC Multiple |
| Addiction Treatment | 2.2% | 1.2% | 1.8x |
| Biotech | 1.9% | 0.7% | 2.7x |
| B2B SaaS | 2.2% | 0.9% | 2.4x |
| Commercial Insurance | 1.8% | 0.9% | 2.0x |
| Construction | 2.0% | 2.1% | 0.95x |
| E-commerce / Retail | 1.7% | 1.4% | 1.2x |
| Financial Services | 2.3% | 0.3% | 7.7x |
| Higher Education & College | 1.5% | 2.3% | 0.7x |
| HVAC Services | 3.5% | 1.7% | 2.1x |
| Industrial IoT | 2.3% | 1.0% | 2.3x |
| Legal Services | 4.6% | 2.2% | 2.1x |
| Manufacturing & Distribution | 3.2% | 1.1% | 2.9x |
| Medical Device | 3.3% | 0.9% | 3.7x |
| Oil & Gas | 1.8% | 1.6% | 1.1x |
| PCB Design & Manufacturing | 2.4% | 1.5% | 1.6x |
| Pharmaceutical | 2.1% | 1.4% | 1.5x |
| Real Estate | 2.9% | 0.9% | 3.2x |
| Solar Energy | 2.8% | 1.8% | 1.6x |
| Transportation & Logistics | 1.5% | 1.1% | 1.4x |
Our team drew three conclusions from this data:
- We found that SEO outconverted PPC in 17 of the 19 industries, with a weighted all-industry average of 2.5% against 1.4%, a gap of 1.1 percentage points.
- Our data showed that PPC led in only two industries, higher education and college at 2.3% against 1.5%, and construction at 2.1% against 2.0%.
- We observed that legal services posted the highest SEO rate at 4.6%, while higher education and college posted the highest PPC rate at 2.3%.
The Highest SEO-to-PPC Conversion Rate Multiples
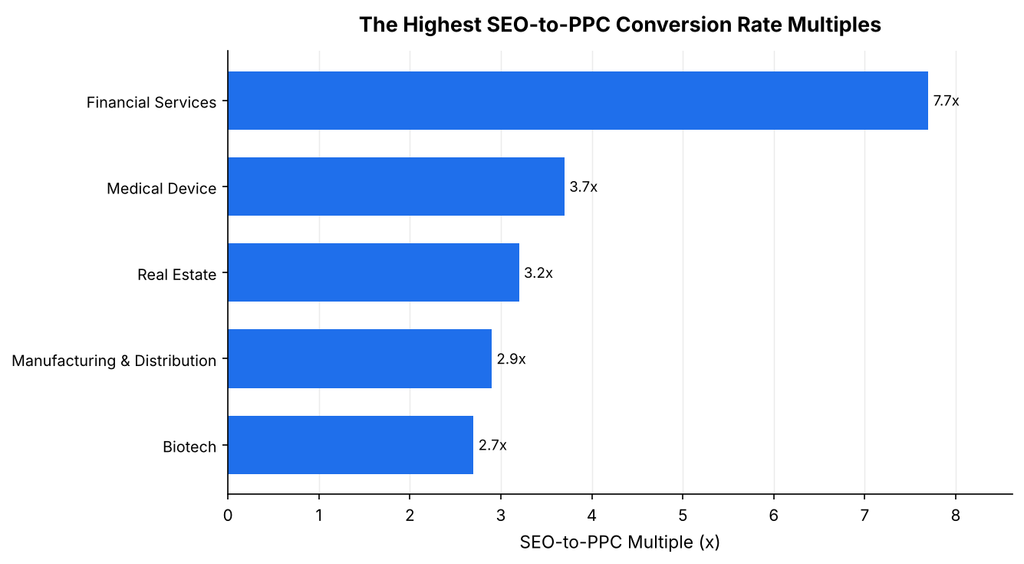
In the table below, we rank the five industries with the highest SEO-to-PPC multiples.
Highest SEO-to-PPC Conversion Rate Multiples, 2026
| Industry | SEO-to-PPC Multiple |
| Financial Services | 7.7x |
| Medical Device | 3.7x |
| Real Estate | 3.2x |
| Manufacturing & Distribution | 2.9x |
| Biotech | 2.7x |
Our team drew three conclusions from these multiples:
- We suspect these industries share a reliance on trust and prestige. A high organic ranking signals leadership, while a paid ad signals only that a company bought the placement.
- We suspect that financial services and medical device companies also face fewer competitors investing seriously in SEO, which may help the firms that do invest.
- We suspect that thought leadership marketing amplifies this trust effect, though our dataset cannot isolate it.
How Conversion Rate Differences Between SEO and PPC Translate to Budget
In the table below, we model one commercial insurance client’s $250,000 annual online budget spent entirely on either channel. Both scenarios use the same 20% close rate and the same first-year customer value of $29,000.
SEO vs. PPC Annual Return for a Commercial Insurance Firm, 2026
| Metric | SEO | PPC |
| Annual spend | $250,000 | $250,000 |
| New targeted visitors | 11,000 | 8,600 |
| Conversion rate | 1.8% | 0.9% |
| Marketing qualified leads | 198 | 77 |
| Close rate | 20% | 20% |
| New clients | 40 | 15 |
| First-year revenue | $1,160,000 | $435,000 |
| Return after spend | $910,000 | $185,000 |
Our team drew three conclusions from this example:
- In this model, the same budget produces 198 marketing qualified leads through SEO and 77 through PPC.
- The return after spend comes to $910,000 for SEO against $185,000 for PPC, about 4.9 times as much.
- We recommend a mix rather than a single channel, because PPC lets a company test keywords quickly and adds visibility alongside organic results. Most of our clients split search spend at about 75% SEO and 25% PPC.
Investing in SEO: In-House vs. Outsourced
Once a company commits to SEO, the next decision is who does the work, a question we cover in depth on our blog. An in-house team offers direct access to experts on the business and familiarity with the brand. However, a dedicated writer, editor, graphic designer, and strategist usually cost more than an agency’s monthly fee.
An agency brings greater institutional expertise, established SEO strategies, specialized tools, and a lower overall cost, and good agencies use subject-matter experts to work with a client’s technical staff. The tradeoffs are an alignment period, less direct control over content, and slower revisions. For most companies, we recommend outsourcing SEO.
Requesting a Copy of This Report
If you would like a PDF copy of this report, or you would like to learn more about our agency, you can get in touch here.
- First Page Sage Research Study. First Page Sage. November 2026. San Francisco, California.
- Conversion Rate Benchmarks in 2026. First Page Sage. November 2026. San Francisco, California.
- Google Ads Benchmarks 2026. Susie Marino, WordStream by LocaliQ. 2026. Online.
- 2024 Google Ads Benchmarks. WordStream. 2024. Online.
- SEO Conversion Statistics Compendium
- Average SEO Conversion Rate By Page Type
- SEO ROI Statistics
- SEO Benchmarks by Industry