From June – September 2026, our research team tracked the results of 1,240 LinkedIn ad campaigns run by 186 B2B and B2C advertisers in North America and Europe. The campaigns accounted for $38.4 million in ad spend and about 2.9 million clicks, which we aggregated and normalized into a single benchmark dataset.
We define conversion rate as the share of ad clicks that end in a completed conversion. For campaigns using LinkedIn Lead Gen Forms, a conversion is a submitted form. For campaigns that send traffic to the advertiser’s own website, a conversion is the action the campaign was built to drive, such as a form fill, a demo request or a registration. We report the two separately because they perform very differently.
In the sections below, we break down LinkedIn ads conversion rates by ad format, by quarter, by industry, by offer and by audience.
Summary of Findings
- The average LinkedIn ads conversion rate was 11.9% for Lead Gen Forms and 3.0% for website landing pages.
- Document Ads converted best at 14.7%, followed by Thought Leader Ads at 13.1%.
- Lead Gen Form conversion rates slipped from 12.5% in Q1 2025 to 11.2% in July and August 2026.
- Higher education converted best among the industries we studied, and legal converted worst.
- Original research offers produced the lowest cost per sales-qualified lead, at $1,153.
- Conversion rates fall as the seniority of the audience and the size of the company rise.
LinkedIn Ads Conversion Rate by Ad Format
The table below shows the average conversion rate for each LinkedIn ad format, split by Lead Gen Forms and website landing pages, along with each format’s average click-through rate and cost per lead. Text Ads and Spotlight Ads cannot use Lead Gen Forms, and Document Ads collect leads through the document itself, so those cells are marked N/A.
LinkedIn Ads Conversion Rate by Ad Format (January 2025 to August 2026)
| Ad Format | Lead Gen Form Conversion Rate | Landing Page Conversion Rate | Average Click-Through Rate | Average Cost per Lead |
| Single Image Ads | 11.9% | 3.2% | 0.53% | $141 |
| Thought Leader Ads | 13.1% | 3.7% | 1.08% | $87 |
| Video Ads | 9.6% | 2.5% | 0.39% | $186 |
| Document Ads | 14.7% | N/A | 0.71% | $94 |
| Carousel Ads | 10.4% | 2.8% | 0.47% | $167 |
| Text Ads | N/A | 1.9% | 0.03% | $214 |
| Spotlight Ads | N/A | 2.3% | 0.08% | $198 |
| All Formats | 11.9% | 3.0% | 0.55% | $144 |
Our team took three main points from this data:
- We found that Lead Gen Forms convert about four times as often as website landing pages. The form opens inside LinkedIn with the member’s profile details already filled in, which removes most of the effort of converting.
- Document Ads and Thought Leader Ads led on both conversion rate and cost per lead. Both formats give the reader something of value before asking for contact details.
- Text Ads and Spotlight Ads had the lowest landing page conversion rates and the highest costs per lead of any format, which matches their small placements on the right rail of the LinkedIn feed.
LinkedIn Ads Conversion Rate by Quarter, Q1 2025 to Q3 2026
Because our dataset spans 20 months, we were able to track how conversion rates moved over time. The table below shows the average for each quarter, followed by a graph of the same data. The final period covers July and August 2026 only.
LinkedIn Ads Conversion Rate by Quarter
| Quarter | Lead Gen Form Conversion Rate | Landing Page Conversion Rate |
| Q1 2025 | 12.5% | 3.3% |
| Q2 2025 | 12.2% | 3.2% |
| Q3 2025 | 12.4% | 2.9% |
| Q4 2025 | 11.8% | 3.1% |
| Q1 2026 | 11.7% | 2.9% |
| Q2 2026 | 11.5% | 2.8% |
| Jul-Aug 2026 | 11.2% | 2.8% |
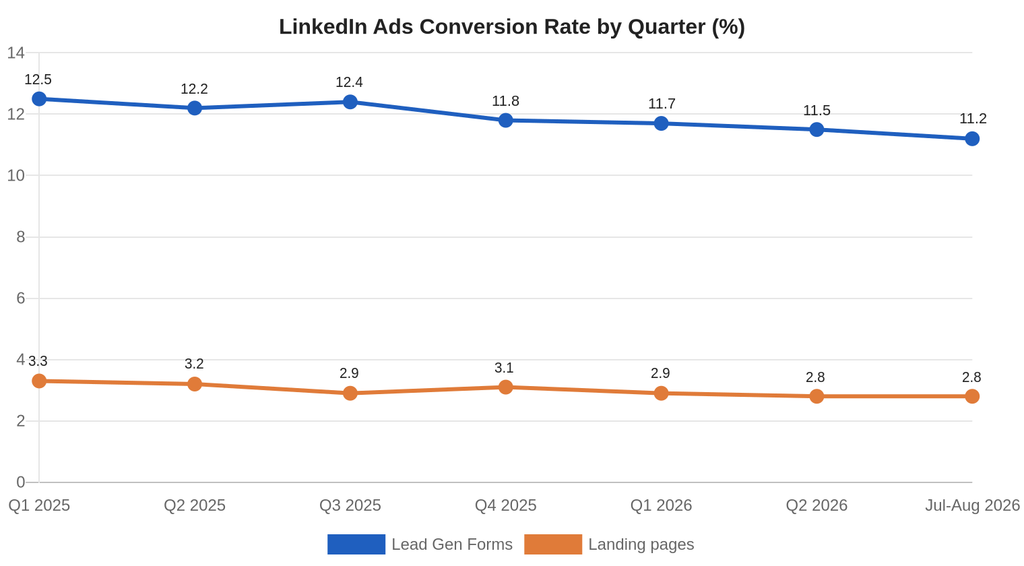
Our researchers drew three conclusions from the trend:
- Lead Gen Form conversion rates fell 1.3 percentage points over the study period, from 12.5% to 11.2%. Advertisers in our sample attributed most of the decline to rising competition for the same senior B2B audiences.
- Landing page conversion rates held steadier, moving within a range of 2.8% to 3.3%.
- Lead Gen Form rates briefly recovered in the third quarter of 2025, when several advertisers in our dataset shifted budget toward Thought Leader Ads and Document Ads.
LinkedIn Ads Conversion Rate by Industry
Conversion rates vary by industry, mostly because of how many advertisers compete for the same audience and how much the offer asks of the person clicking. The table below shows our benchmarks for 12 industries, followed by a chart comparing the two conversion types.
LinkedIn Ads Conversion Rate by Industry (January 2025 to August 2026)
| Industry | Lead Gen Form Conversion Rate | Landing Page Conversion Rate | Average Cost per Lead |
| Higher education | 15.6% | 4.6% | $72 |
| Nonprofit | 14.4% | 4.3% | $63 |
| Staffing and recruiting | 13.7% | 4.1% | $86 |
| Insurance | 13.1% | 3.8% | $171 |
| Financial services | 12.6% | 3.4% | $196 |
| Manufacturing and industrial | 12.2% | 3.5% | $118 |
| Logistics and supply chain | 11.8% | 3.3% | $109 |
| Professional services and consulting | 11.4% | 3.2% | $152 |
| Software and SaaS | 10.9% | 2.7% | $178 |
| Healthcare and medical technology | 10.3% | 2.9% | $163 |
| IT services and cybersecurity | 9.8% | 2.3% | $214 |
| Legal | 8.7% | 2.6% | $246 |
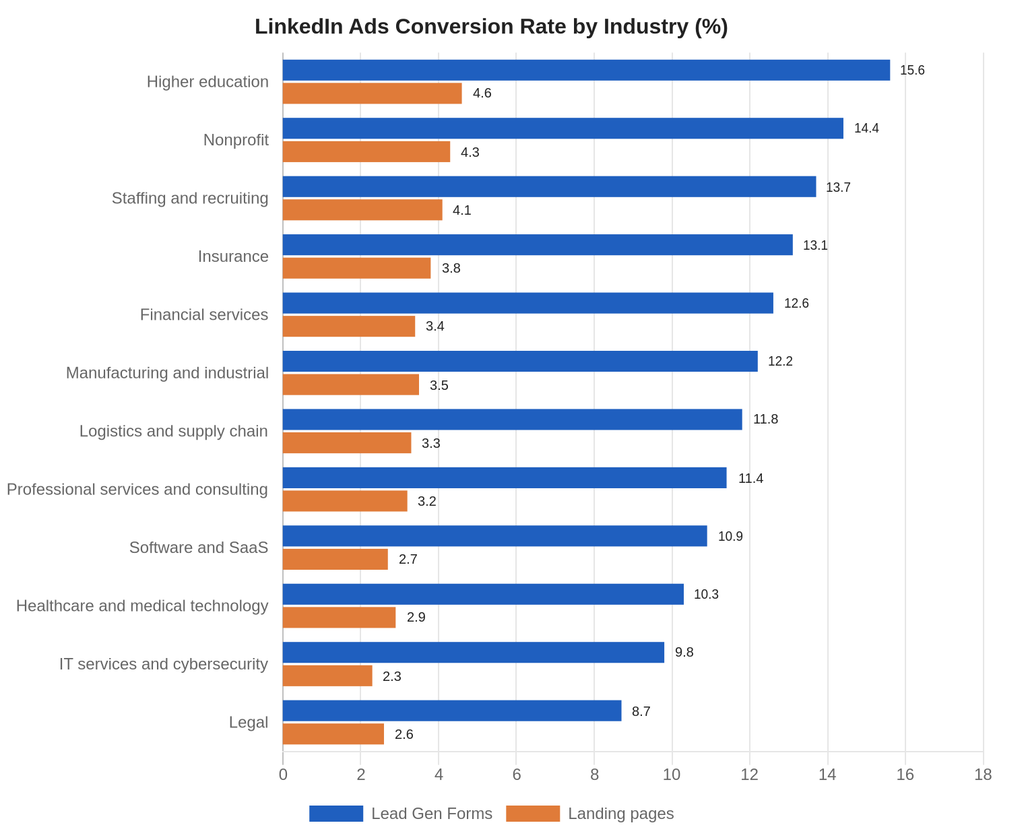
Three patterns stood out to our team:
- Higher education, nonprofit and staffing advertisers converted best and paid the least per lead. Their offers, such as program guides, volunteer sign-ups and job alerts, ask little of the person clicking.
- Legal, IT services and cybersecurity advertisers had the lowest Lead Gen Form conversion rates and the highest costs per lead. Their buyers are senior, heavily targeted and slow to share contact details.
- Insurance and financial services converted above average despite high costs per lead, which suggests their audiences respond well to quotes and calculators delivered through Lead Gen Forms.
LinkedIn Ads Conversion Rate by Offer Type
The offer behind an ad has a larger effect on conversion rate than any other factor we measured. To show what each offer is worth, we also tracked how many leads became sales-qualified leads (SQLs), meaning buyers who matched the advertiser’s target profile and were actively looking to buy. The table below is sorted from the lowest cost per SQL to the highest.
LinkedIn Ads Conversion Rate by Offer Type (January 2025 to August 2026)
| Offer Type | Lead Gen Form Conversion Rate | Landing Page Conversion Rate | Average Cost per Lead | Lead-to-SQL Rate | Average Cost per SQL |
| Original research or benchmark report | 16.8% | 5.7% | $68 | 5.9% | $1,153 |
| Webinar registration | 13.2% | 4.4% | $96 | 7.6% | $1,263 |
| Demo request | 4.8% | 2.1% | $318 | 22.7% | $1,401 |
| Consultation or assessment | 5.6% | 2.4% | $284 | 19.4% | $1,464 |
| Free trial | 6.9% | 2.6% | $231 | 14.2% | $1,627 |
| Ebook or guide | 15.9% | 5.3% | $74 | 4.1% | $1,805 |
| Event or conference registration | 9.7% | 3.1% | $122 | 6.3% | $1,937 |
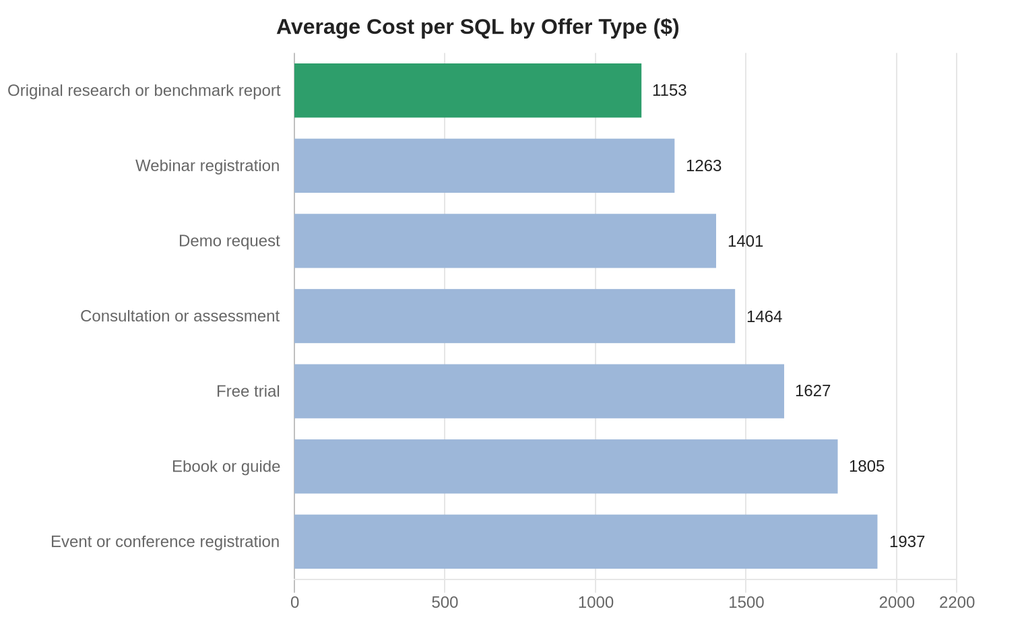
Here is what our researchers took from the offer data:
- Original research and benchmark reports produced the lowest cost per SQL in our dataset at $1,153. They convert more often than ebooks, and the people who download them are more likely to be evaluating vendors.
- Demo requests had the lowest conversion rate at 4.8% but the highest lead-to-SQL rate at 22.7%, which kept their cost per SQL of $1,401 below that of ebooks and guides.
- Event and conference registrations were the most expensive offer per SQL at $1,937, since most registrants were looking for education rather than a vendor.
LinkedIn Ads Conversion Rate by Seniority and Company Size
LinkedIn’s targeting lets advertisers reach people by job seniority and by the size of the company they work for. The table below shows the Lead Gen Form conversion rate for each combination, with darker cells marking higher conversion rates.
LinkedIn Lead Gen Form Conversion Rate by Seniority and Company Size
(January 2025 to August 2026)
| Seniority | 1 to 50 Employees | 51 to 200 Employees | 201 to 1,000 Employees | 1,001 to 5,000 Employees | 5,001+ Employees |
| Entry level | 14.8% | 14.4% | 13.9% | 12.5% | 11.7% |
| Senior individual contributor | 13.8% | 13.1% | 12.2% | 11.3% | 10.5% |
| Manager | 13.0% | 12.1% | 11.8% | 10.8% | 10.3% |
| Director | 11.9% | 11.0% | 10.9% | 9.6% | 9.2% |
| Vice president | 10.4% | 9.4% | 9.4% | 8.7% | 8.2% |
| C-suite and owner | 11.5% | 10.0% | 8.8% | 8.0% | 7.1% |
Our team found three patterns in the audience data:
- Conversion rates fall steadily with seniority. Entry-level members at companies with 50 or fewer employees converted at 14.8%, while C-suite members at companies with more than 5,000 employees converted at 7.1%.
- The exception is the C-suite at small companies, where conversion rates reached 11.5%. At that size, executives are usually the buyers themselves and have fewer gatekeepers.
- Lower conversion rates among senior audiences do not mean lower value. In our dataset, leads at the director level and above became SQLs at more than twice the rate of leads below the manager level, a pattern that also shows up in our B2B SaaS funnel conversion benchmarks.
Advertisers comparing LinkedIn with other channels can find our benchmarks for conversion rates by marketing channel.
Requesting a Copy of This Report
If you’d like to request a PDF copy of this report or learn more about our agency, you can reach out here.
- First Page Sage Research Study. First Page Sage. June 14 – September 29, 2026. San Francisco, California.
- LinkedIn Ads Benchmarks: 2026 CTR, CPC, CPL, Conversion, and Pipeline Ranges. Eduardo Yi, ClickMinded. July 8, 2026. San Francisco, California.
- LinkedIn Ads Benchmarks 2026: CPC, CPM, CTR, CVR & CPL. Ishan Manchanda, GrowthSpree. July 23, 2026. New Hyde Park, New York.
- LinkedIn Benchmarks. Matthew Gibbons, WebFX. September 19, 2026. Harrisburg, Pennsylvania.