Between July 6 and September 25, 2026, our research team studied how people and organizations use Microsoft Copilot across its consumer and business products. We combined usage logs shared by 71 organizations licensed for Microsoft 365 Copilot, web traffic panel data for the consumer Copilot app and website, a survey of 1,420 U.S. knowledge workers, and Microsoft’s own quarterly disclosures, then normalized the figures into a single dataset.
Microsoft uses the Copilot name for several products: the free consumer assistant in Windows, Edge, Bing and the Copilot app; Microsoft 365 Copilot Chat, which business users receive at no extra cost; the paid Microsoft 365 Copilot license that works inside Word, Excel, PowerPoint, Outlook and Teams; and GitHub Copilot for software developers. Where a figure covers only one of these products, the row or column label says so.
In the sections below, we break down Copilot’s user base, the growth of paid seats, usage by product, the tasks people use it for, and adoption by industry.
Summary of Findings
- Microsoft Copilot reached 110 million monthly active users in September 2026, up 3% from the prior quarter.
- Microsoft 365 Copilot paid seats grew to an estimated 36.2 million, about 7.7% of Microsoft 365 commercial seats.
- Business products drove all of the quarter’s growth, while every consumer Copilot product lost users.
- Drafting documents and summarizing emails, meetings and files make up 45.9% of all Copilot prompts.
- Professional services firms lead adoption, licensing 28.6% of their employees on average.
Microsoft Copilot Usage Overview
The table below gathers the core usage figures for Microsoft Copilot at the end of our study period. The first four rows describe Copilot as a whole, and the remaining rows describe individual products.
Microsoft Copilot Usage Overview (September 2026)
| Metric | Figure |
| Monthly active users, all Copilot products | 110 million |
| Quarter-over-quarter growth in monthly active users | 3% |
| Monthly visits to Copilot on the web | 97 million |
| U.S. AI chatbot market share | 1.3% |
| Microsoft 365 Copilot paid seats | 36.2 million |
| Share of Microsoft 365 commercial seats with a paid Copilot license | 7.7% |
| Weekly active rate among paid Microsoft 365 Copilot seats | 64.3% |
| Average prompts per weekly active user, per week | 23.6 |
| GitHub Copilot users (tracked separately) | 52.6 million |
Our team took three main points from this data:
- We found that Copilot’s audience is large in absolute terms but small next to its competitors. 110 million monthly users works out to a 1.3% share of U.S. AI chatbot usage, well behind ChatGPT and Google Gemini (including AI Mode in Google Search).
- Our data showed that about one in three paid Microsoft 365 Copilot seats goes unused in a typical week. Most licensed organizations in our sample told us they are working to close that gap with training.
- GitHub Copilot, which we track separately, has nearly half as many users as all other Copilot products combined, which makes it Microsoft’s most widely used AI product within a single profession.
Microsoft 365 Copilot Paid Seats, Q1 2024 to Q3 2026
Paid seats are the clearest measure of business demand for Copilot, since each one is a per-user license an organization chose to buy. The table below tracks our estimate of paid seats at the end of each quarter, followed by a graph of the same data.
Microsoft 365 Copilot Paid Seats by Quarter
| Quarter | Paid Seats | Net New Seats | Share of Microsoft 365 Commercial Seats |
| Q1 2024 | 1.1 million | 1.1 million | 0.3% |
| Q2 2024 | 2.4 million | 1.3 million | 0.6% |
| Q3 2024 | 3.6 million | 1.2 million | 0.9% |
| Q4 2024 | 5.2 million | 1.6 million | 1.2% |
| Q1 2025 | 6.9 million | 1.7 million | 1.6% |
| Q2 2025 | 8.7 million | 1.8 million | 2.0% |
| Q3 2025 | 11.1 million | 2.4 million | 2.5% |
| Q4 2025 | 15.6 million | 4.5 million | 3.5% |
| Q1 2026 | 19.8 million | 4.2 million | 4.4% |
| Q2 2026 | 29.7 million | 9.9 million | 6.4% |
| Q3 2026 | 36.2 million | 6.5 million | 7.7% |
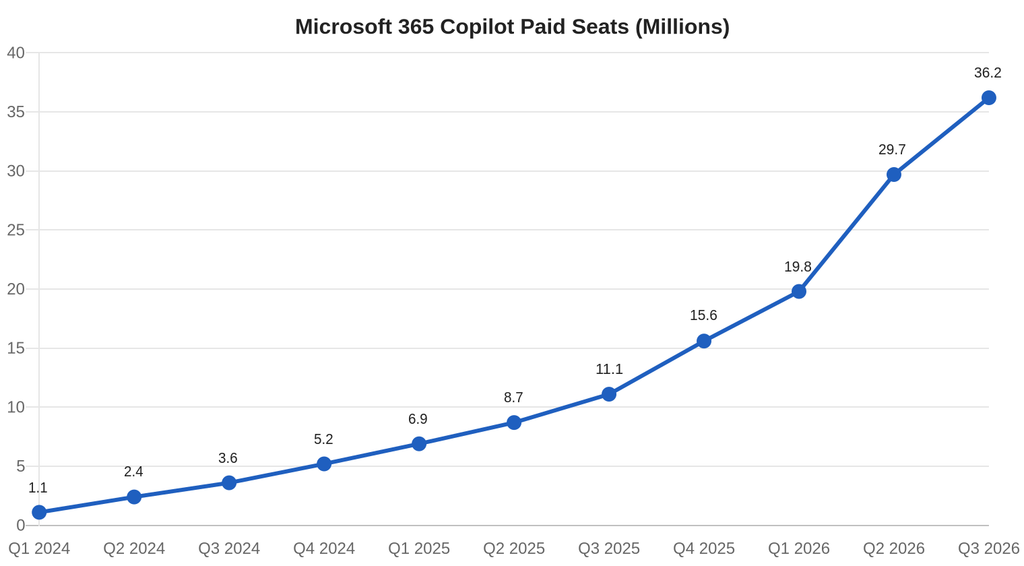
Our researchers drew three conclusions from the trend:
- Growth was slow through 2024, when most organizations ran small pilots, and sped up in 2026 once large enterprises began licensing entire departments and workforces.
- The second quarter of 2026 added 9.9 million seats, the largest single-quarter gain we recorded and more than double the 4.2 million added the quarter before.
- Even at 36.2 million seats, about 92% of Microsoft 365 commercial users do not have a paid Copilot license, which leaves Microsoft a large existing customer base to sell into.
Microsoft Copilot Monthly Active Users by Product
Copilot’s 110 million monthly users are spread across five products. To avoid counting people who use more than one product twice, our model assigns each user to the product they used most often during the month. The table below shows the result.
Microsoft Copilot Monthly Active Users by Product (September 2026)
| Product | Monthly Active Users | Share of Copilot Users | Change vs. Prior Quarter |
| Microsoft 365 Copilot Chat (free with business accounts) | 34.6 million | 31.5% | +4.5% |
| Microsoft 365 Copilot (paid license) | 27.9 million | 25.4% | +25.1% |
| Copilot app and website | 24.2 million | 22.0% | -6.6% |
| Copilot in Windows | 14.1 million | 12.8% | -6.0% |
| Copilot in Edge and Bing | 9.2 million | 8.4% | -12.4% |
| All Copilot products | 110.0 million | 100% | +3.0% |
Three findings stood out to our team:
- Microsoft 365 Copilot Chat, the free assistant included with business accounts, is the largest entry point to Copilot at 31.5% of users.
- Paid Microsoft 365 Copilot was the fastest-growing product, up 25.1% over the quarter, in line with the growth in paid seats shown above.
- Every consumer product lost users during the quarter, with Copilot in Edge and Bing falling the most at 12.4%. Our data suggests that Copilot’s growth now depends almost entirely on the workplace.
How People Use Microsoft Copilot
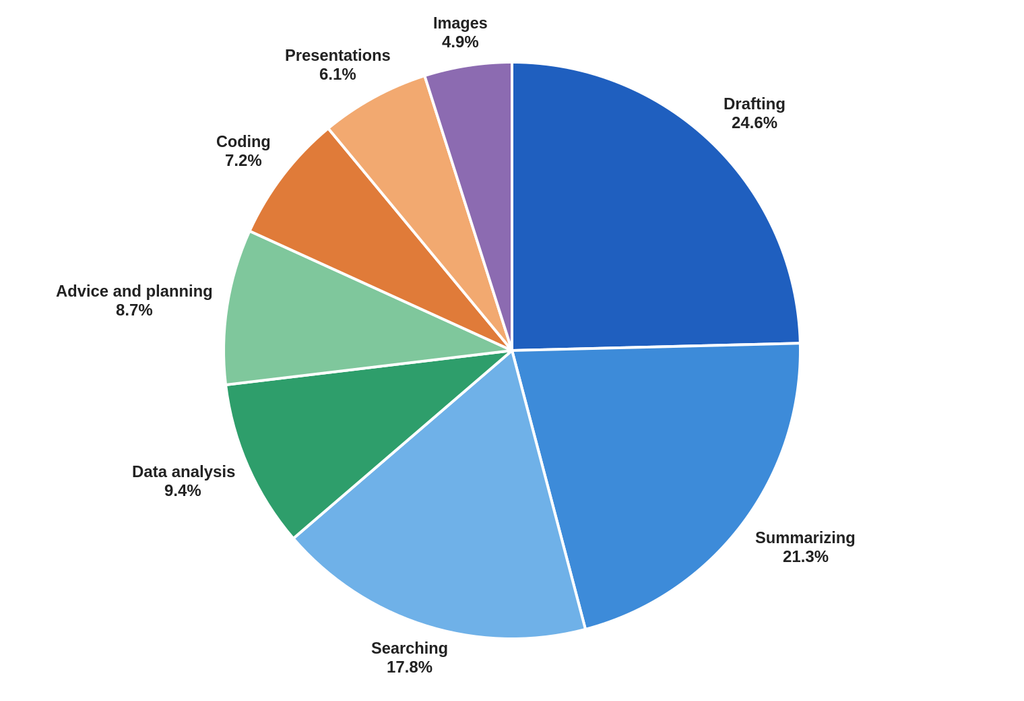
We classified a sample of 412,000 anonymized prompts from participating organizations and consumer panelists into eight task types. The table below shows each task’s share of prompts and the app where it happens most often, followed by a chart of the same breakdown.
Microsoft Copilot Prompts by Task Type (September 2026)
| Task Type | Share of Prompts | App Where It Happens Most |
| Drafting and editing documents | 24.6% | Word |
| Summarizing emails, meetings and files | 21.3% | Outlook and Teams |
| Searching for information | 17.8% | Copilot app and website |
| Analyzing data | 9.4% | Excel |
| Personal advice and planning | 8.7% | Copilot app and website |
| Writing and debugging code | 7.2% | Copilot app and website |
| Building presentations | 6.1% | PowerPoint |
| Creating images | 4.9% | Copilot app and website |
Here is what our researchers took from the breakdown:
- Drafting and summarizing together make up 45.9% of prompts. Most people use Copilot to speed up the writing and reading they would otherwise do by hand.
- Data analysis in Excel accounts for only 9.4% of prompts, even though Microsoft promotes it heavily. Licensed users we surveyed said they still check Copilot’s formulas and charts by hand before relying on them.
- Coding requests make up 7.2% of prompts outside GitHub Copilot, since developers do most of that work in GitHub Copilot instead.
Microsoft 365 Copilot Adoption by Industry
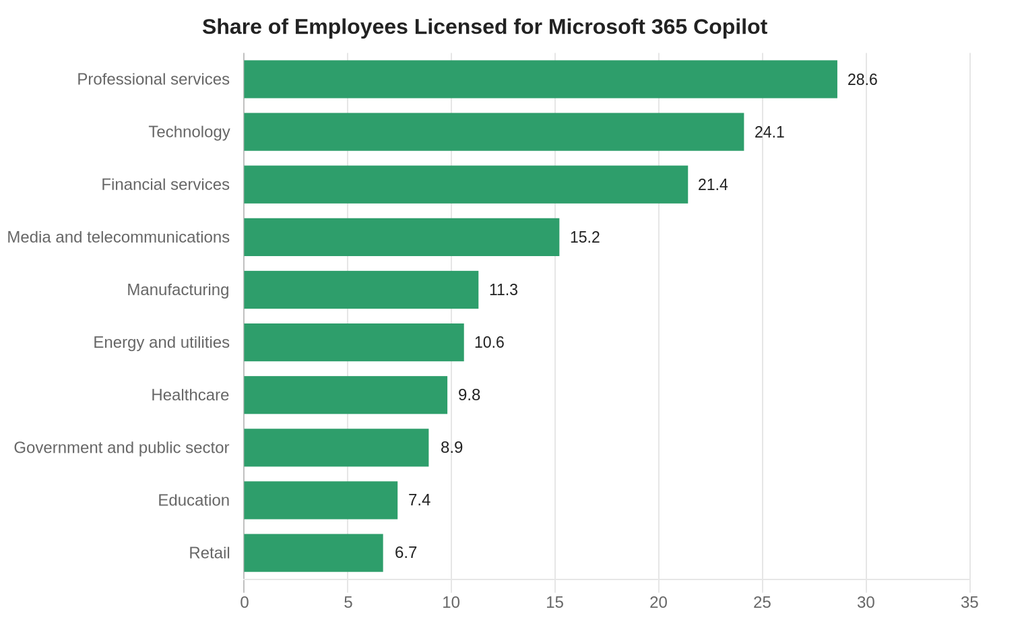
Adoption of paid Microsoft 365 Copilot varies widely from one industry to the next. The table below shows the share of organizations in each industry that hold paid licenses, the share of employees licensed within those organizations, and the share of licensed employees who use Copilot in a typical week.
Microsoft 365 Copilot Adoption by Industry (September 2026)
| Industry | Organizations With Paid Licenses | Employees Licensed Within Those Organizations | Weekly Active Rate Among Licensed Employees |
| Professional services | 61.7% | 28.6% | 71.2% |
| Technology | 54.9% | 24.1% | 69.5% |
| Financial services | 58.3% | 21.4% | 66.9% |
| Media and telecommunications | 44.7% | 15.2% | 63.8% |
| Manufacturing | 41.6% | 11.3% | 59.6% |
| Energy and utilities | 39.5% | 10.6% | 58.2% |
| Healthcare | 37.2% | 9.8% | 57.4% |
| Government and public sector | 33.8% | 8.9% | 54.1% |
| Education | 26.1% | 7.4% | 49.3% |
| Retail | 29.4% | 6.7% | 52.8% |
Our team found three patterns in the industry data:
- Professional services firms lead on every measure, with 61.7% holding licenses and 28.6% of employees licensed on average. Consulting, accounting and legal work is heavy on documents and meetings, the tasks Copilot handles best.
- Retail and education trail the field, largely because much of their workforce does not work in Microsoft 365 every day.
- Weekly active rates rise with the share of employees licensed. Industries that roll Copilot out widely also see more of their licensed staff use it each week.
Requesting a Copy of This Report
If you’d like to request a PDF copy of this report or learn more about our agency, you can reach out here.
- First Page Sage Research Study. First Page Sage. September 2026. San Francisco, California.
- FY26 Q4 Press Release. Microsoft Corporation. July 29, 2026. Redmond, Washington.
- Azure Tops $100 Billion As Microsoft Reports FY26 Q4 Results. Tony Redmond, Office 365 for IT Pros. July 30, 2026. Dublin, Ireland.
- Microsoft 365 Copilot hits 20 million paid seats. Matt Vartabedian, No Jitter. May 1, 2026. Newton, Massachusetts.
- Microsoft Claims 15 Million Paid M365 Copilot Seats. Mary Jo Foley, Directions on Microsoft. January 29, 2026. Kirkland, Washington.