Last updated: September 21, 2026
Between May 15 and September 10, 2026, our research team tracked agent usage across 40 platforms in the U.S. and international markets, drawing on company disclosures, app store telemetry, enterprise procurement records, and a panel of 1,900 organizations that allowed us to observe agent invocation at the account level.
We define an AI agent as software that accepts a goal, decomposes it into subtasks on its own, reasons and acts progressively toward completion, and operates outside tools, applications, or systems along the way. Three adjacent categories fail that definition and are excluded from every table below. Single turn chat assistants are excluded, since answering a question is not pursuing a goal. Agent frameworks and orchestration layers such as LangGraph and Bedrock AgentCore are excluded, since they are used to build agents rather than to run work. Fast decision and classification models are excluded as well, since they are called by agents to route work and select tools rather than setting goals of their own.
Market share is calculated as each platform’s monthly active users divided by the aggregate monthly active users we tracked across all agents, which grew from 142 million in Q3 2025 to 293 million in Q3 2026. Because most people now run more than one agent, these figures describe platform reach rather than distinct individuals. In the sections below, we rank the market, trace five quarters of movement, identify the fastest growing agents, benchmark how often each agent finishes what it starts, and break adoption down by professional use case, consumer use case, and company size.
Top AI Agents by Market Share
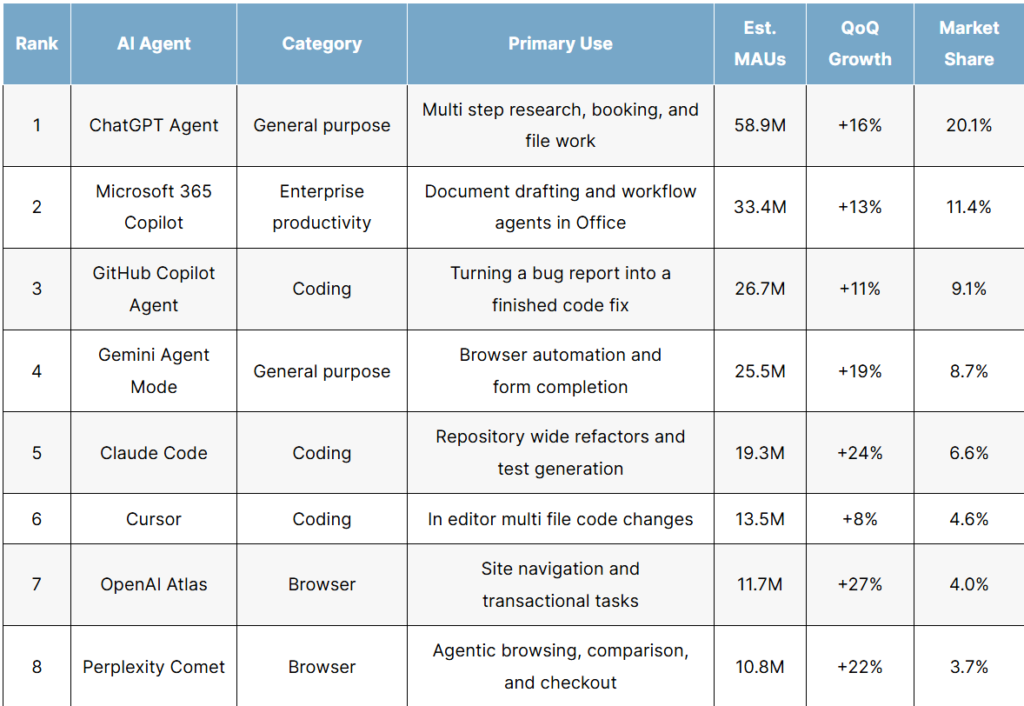
In the table below, we rank the 16 agents that individually exceeded 0.5% of tracked usage during the study window, with the remaining platforms grouped as a single long tail.
The Top AI Agents by Market Share, 2026
| Rank | AI Agent | Category | Primary Use | Est. MAUs | QoQ Growth | Market Share |
| 1 | ChatGPT Agent | General purpose | Multi step research, booking, and file work | 58.9M | +16% | 20.1% |
| 2 | Microsoft 365 Copilot | Enterprise productivity | Document drafting and workflow agents in Office | 33.4M | +13% | 11.4% |
| 3 | GitHub Copilot Agent | Coding | Turning a bug report into a finished code fix | 26.7M | +11% | 9.1% |
| 4 | Gemini Agent Mode | General purpose | Browser automation and form completion | 25.5M | +19% | 8.7% |
| 5 | Claude Code | Coding | Repository wide refactors and test generation | 19.3M | +24% | 6.6% |
| 6 | Cursor | Coding | In editor multi file code changes | 13.5M | +8% | 4.6% |
| 7 | OpenAI Atlas | Browser | Site navigation and transactional tasks | 11.7M | +27% | 4.0% |
| 8 | Perplexity Comet | Browser | Agentic browsing, comparison, and checkout | 10.8M | +22% | 3.7% |
| 9 | Salesforce Agentforce | Enterprise CRM | Support deflection and pipeline hygiene | 9.1M | +15% | 3.1% |
| 10 | Grok Bot | Always on | Persistent agents with their own cloud computer | 7.9M | New | 2.7% |
| 11 | Instinct | Personal assistant | Reservations, sign ups, and outbound calls | 7.6M | +186% | 2.6% |
| 12 | Amazon Q Developer | Cloud and coding ops | Infrastructure changes and cost remediation | 7.3M | +10% | 2.5% |
| 13 | Manus | General purpose | Long running research and deliverable builds | 6.2M | +12% | 2.1% |
| 14 | Meta Muse | Personal assistant | Consumer errands and business calls | 4.1M | New | 1.4% |
| 15 | Replit Agent | Coding | Prototype to deployed app generation | 3.8M | +7% | 1.3% |
| 16 | Devin | Coding | Autonomous ticket completion | 2.1M | -6% | 0.7% |
| All other agents | Mixed | Long tail of vertical and open source agents | 45.1M | +14% | 15.4% |
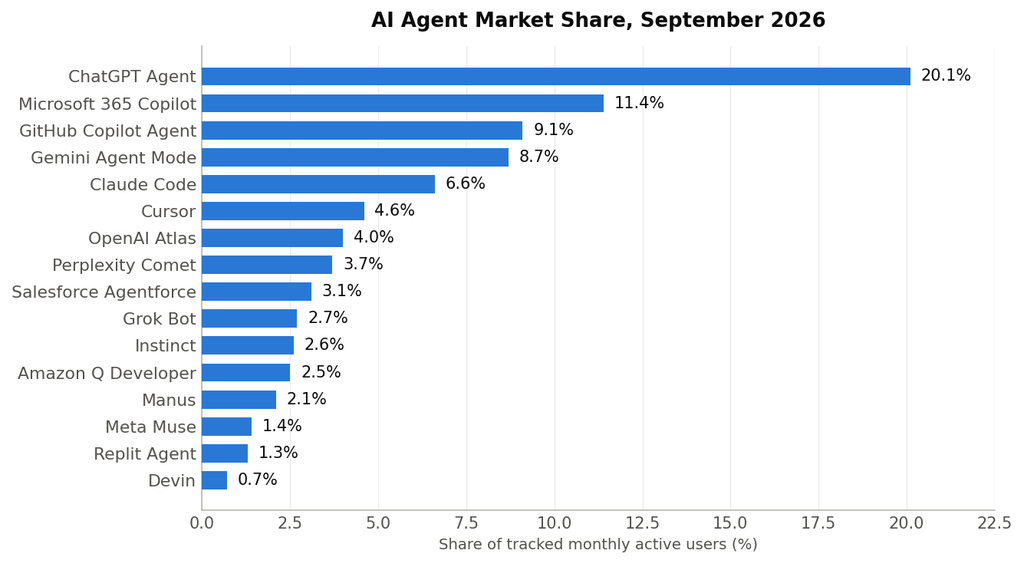
- We found that the four largest agents hold 49.3% of the market between them, down from 58.6% a year earlier, which is the clearest evidence in our dataset that the category is fragmenting rather than consolidating.
- Our data showed that coding agents account for 24.8% of all agent usage, the largest single category, though their combined share fell 3.2 points over the past four quarters as general purpose and browser agents absorbed routine work.
- We observed that the two most recently released agents, Grok Bot and Meta Muse, reached a combined 4.1% of the market within seven weeks of launch, the fastest category entry our researchers have recorded.
AI Agent Market Share Trend, Q3 2025 to Q3 2026
In the table below, we track quarterly market share for the six agents with the longest continuous measurement history, then plot the same figures beneath it.
The AI Agent Market Share Trend, 2026
| AI Agent | Q3 2025 | Q4 2025 | Q1 2026 | Q2 2026 | Q3 2026 |
| ChatGPT Agent | 24.9% | 24.1% | 22.8% | 21.4% | 20.1% |
| Microsoft 365 Copilot | 14.1% | 13.4% | 12.9% | 11.8% | 11.4% |
| GitHub Copilot Agent | 12.6% | 11.8% | 11.1% | 9.8% | 9.1% |
| Gemini Agent Mode | 4.6% | 5.9% | 6.8% | 8.2% | 8.7% |
| Claude Code | 2.9% | 3.8% | 4.7% | 5.9% | 6.6% |
| Perplexity Comet | 1.3% | 1.7% | 2.3% | 3.1% | 3.7% |
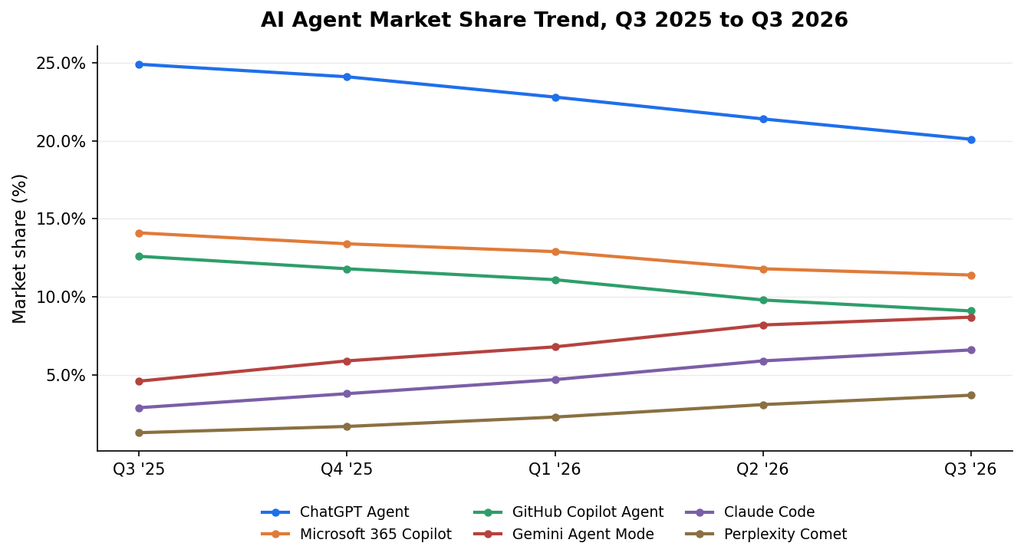
The five quarter series describes a market losing its center of gravity rather than one changing hands. ChatGPT Agent gave up 4.8 points of share and still finished the period with more usage than the second and third ranked agents combined, because the total market grew faster than its share declined. The same pattern holds for Microsoft 365 Copilot and GitHub Copilot Agent, both of which added users in absolute terms across every quarter we measured while losing relative position. Our researchers normalized each quarter against that quarter’s tracked universe, so a falling line indicates dilution by new entrants, not contraction. Gemini Agent Mode and Claude Code together captured 7.8 points of the share released by the incumbents, and the long tail absorbed most of the remainder.
Fastest Growing AI Agents, Q3 2025 to Q3 2026
In the table below, we rank agents by average monthly user growth over the period each was measured, then plot the fastest movers beneath it.
The Fastest Growing AI Agents, 2026
| Rank | AI Agent | Measured Over | Starting MAUs | Q3 2026 MAUs | Total Growth | Avg. Monthly Growth |
| 1 | Grok Bot | 1 month | 1.9M | 7.9M | +316% | +316% |
| 2 | Instinct | 12 months | 0.4M | 7.6M | +1,800% | +27.8% |
| 3 | OpenAI Atlas | 12 months | 0.9M | 11.7M | +1,200% | +23.8% |
| 4 | Perplexity Comet | 12 months | 1.8M | 10.8M | +500% | +16.1% |
| 5 | Claude Code | 12 months | 4.1M | 19.3M | +371% | +13.8% |
| 6 | Gemini Agent Mode | 12 months | 6.5M | 25.5M | +292% | +12.1% |
| 7 | Manus | 12 months | 2.2M | 6.2M | +182% | +9.0% |
| 8 | Replit Agent | 12 months | 1.6M | 3.8M | +138% | +7.5% |
| 9 | Salesforce Agentforce | 12 months | 4.3M | 9.1M | +112% | +6.4% |
| 10 | Amazon Q Developer | 12 months | 3.6M | 7.3M | +103% | +6.1% |
| 11 | Microsoft 365 Copilot | 12 months | 20.0M | 33.4M | +67% | +4.4% |
| 12 | ChatGPT Agent | 12 months | 35.4M | 58.9M | +66% | +4.3% |
| 13 | GitHub Copilot Agent | 12 months | 17.9M | 26.7M | +49% | +3.4% |
| 14 | Cursor | 12 months | 9.9M | 13.5M | +36% | +2.6% |
| 15 | Devin | 12 months | 2.7M | 2.1M | -22% | -2.1% |
Note: Grok Bot launched in August 2026 and is measured across one month. Meta Muse launched on the final weekend of the study window and has no measurable period.
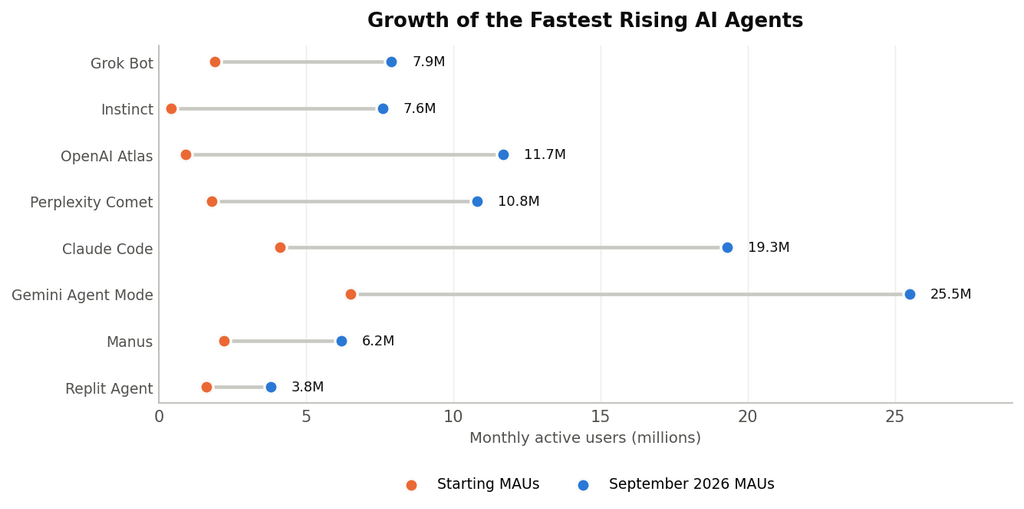
- We found that Grok Bot expanded 316% in its first full month of availability, a rate no established agent approaches, though our researchers treat a single month as provisional and expect the figure to moderate as its base grows.
- Our data showed that Instinct set the pace over a longer horizon, holding 27.8% per month across a full year from a starting base of 400,000 users.
- We observed that momentum and competitive impact diverge further down the table, with Gemini Agent Mode gaining 4.1 points of share against Instinct’s 2.3 despite growing at a fraction of the rate, because Gemini expanded from a base fifteen times larger.
Top AI Agents by Task Completion Rate
In the table below, we report results from our own benchmark, in which each agent attempted 48 standardized multi step tasks across five trials, for 240 runs per platform. A task counts as complete only when the agent finished it end to end with no human correction.
The Top AI Agents by Task Completion Rate, 2026
| AI Agent | Completed Unassisted | Partial Completion | Avg. Steps per Task | Median Time to Complete |
| Claude Code | 72.1% | 18.4% | 14.6 | 6 min 08 s |
| ChatGPT Agent | 65.3% | 22.1% | 16.4 | 8 min 52 s |
| Grok Bot | 63.7% | 23.8% | 22.3 | 19 min 14 s |
| Gemini Agent Mode | 59.6% | 25.1% | 15.9 | 7 min 33 s |
| Instinct | 58.4% | 26.2% | 17.8 | 11 min 47 s |
| GitHub Copilot Agent | 57.2% | 26.9% | 13.1 | 5 min 41 s |
| Cursor | 55.8% | 27.6% | 13.8 | 5 min 22 s |
| Manus | 51.4% | 29.8% | 19.6 | 12 min 58 s |
| OpenAI Atlas | 49.7% | 30.4% | 11.9 | 4 min 51 s |
| Perplexity Comet | 47.9% | 31.5% | 11.4 | 4 min 39 s |
| Salesforce Agentforce | 46.3% | 31.1% | 9.8 | 3 min 56 s |
| Amazon Q Developer | 44.1% | 32.4% | 12.5 | 7 min 02 s |
| Meta Muse | 43.6% | 33.2% | 12.7 | 6 min 27 s |
| Replit Agent | 42.5% | 33.9% | 15.1 | 7 min 46 s |
| Devin | 37.8% | 35.6% | 18.5 | 11 min 31 s |
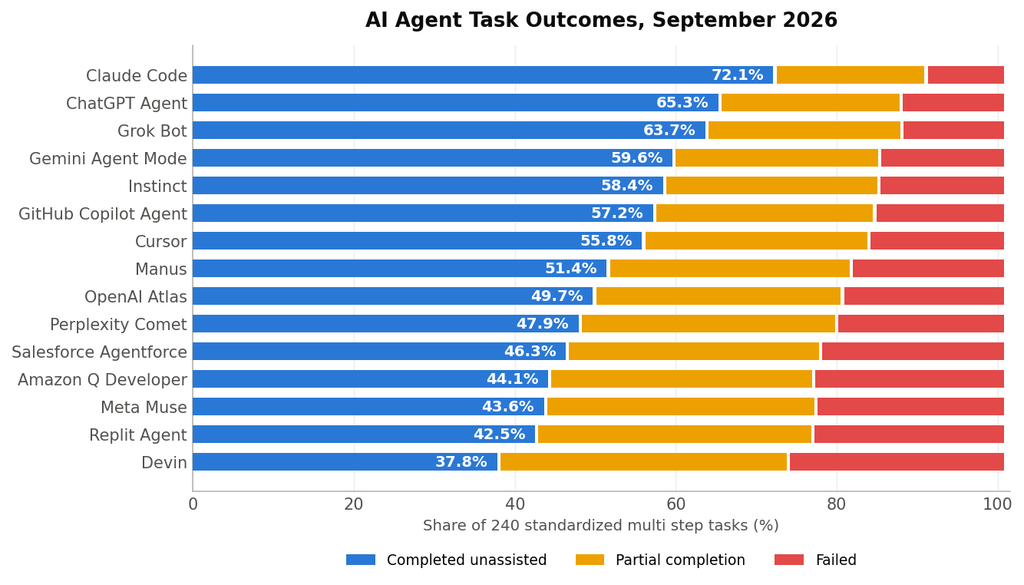
Completion rate and market share correlate weakly in our data. Claude Code finished 72.1% of tasks unassisted while holding 6.6% of the market, and ChatGPT Agent finished 65.3% while holding 20.1%, so distribution is currently doing more to determine share than reliability is. Grok Bot’s 19 minute median is a consequence of its architecture rather than a weakness, since its agents run on their own cloud instances and continue working while the user is offline, which makes elapsed time a poor proxy for effort. Our researchers held task difficulty constant across platforms and scored partial completion separately so that an agent stopping to ask a clarifying question is not penalized as heavily as one that fails silently.
Top AI Agents by Professional Use Case
In the table below, we identify the leading and second place agent for each of the sixteen professional use cases that generated the most tracked invocations, along with the leader’s share of that category.
The Top AI Agents by Professional Use Case, 2026
| Use Case | Leading Agent | Runner Up | Leader’s Category Share |
| Building new websites | Replit Agent | Cursor | 26.8% |
| Backend and API development | Claude Code | GitHub Copilot Agent | 31.2% |
| Code review and pull requests | GitHub Copilot Agent | Claude Code | 34.7% |
| Bug reproduction and triage | Claude Code | Devin | 28.9% |
| Legacy code migration | Claude Code | Amazon Q Developer | 33.5% |
| Cloud infrastructure management | Amazon Q Developer | Claude Code | 30.9% |
| Market and competitive research | ChatGPT Agent | Manus | 32.1% |
| Data analysis and reporting | ChatGPT Agent | Claude Code | 27.3% |
| Document drafting and editing | Microsoft 365 Copilot | ChatGPT Agent | 41.6% |
| Spreadsheet modeling | Microsoft 365 Copilot | ChatGPT Agent | 38.2% |
| Slide deck production | Microsoft 365 Copilot | Manus | 35.9% |
| CRM data hygiene | Salesforce Agentforce | Grok Bot | 44.3% |
| Sales prospecting and outreach | Grok Bot | Salesforce Agentforce | 24.6% |
| Customer support deflection | Salesforce Agentforce | Gemini Agent Mode | 29.2% |
| Recruiting and candidate screening | Grok Bot | ChatGPT Agent | 21.8% |
| Invoice and expense processing | Grok Bot | Microsoft 365 Copilot | 26.4% |
- We found that Claude Code leads three of the sixteen professional categories while GitHub Copilot Agent leads one, despite GitHub Copilot Agent holding 2.5 points more overall market share, which indicates that breadth of installation and depth of use diverge inside engineering organizations.
- Our data showed that building new websites is the least concentrated category in the table at 26.8%, with four agents above 15% share, which suggests buyers still treat site generation as a commodity capability.
- We observed that Grok Bot leads three categories within seven weeks of launch, all of them continuous rather than project based, which is consistent with an architecture that keeps agents running while the user is away.
Top AI Agents by Consumer Use Case
In the table below, we break out the fourteen consumer use cases our panel recorded most often, which follow a different competitive pattern from the professional categories above.
The Top AI Agents by Consumer Use Case, 2026
| Use Case | Leading Agent | Runner Up | Leader’s Category Share |
| Concert and event ticket drops | Grok Bot | OpenAI Atlas | 38.7% |
| Sneaker and merchandise drops | Grok Bot | Perplexity Comet | 41.2% |
| Limited release restocks | Grok Bot | OpenAI Atlas | 36.4% |
| Restaurant reservations | Instinct | Meta Muse | 46.5% |
| Appointment scheduling | Instinct | Meta Muse | 43.9% |
| Bill disputes and refunds | Instinct | Meta Muse | 51.3% |
| Subscription cancellation | Instinct | Grok Bot | 44.8% |
| Price tracking and checkout | Perplexity Comet | OpenAI Atlas | 33.8% |
| Flight and hotel booking | ChatGPT Agent | OpenAI Atlas | 29.4% |
| Travel itinerary planning | Manus | ChatGPT Agent | 25.6% |
| Grocery ordering and reordering | Meta Muse | Instinct | 27.1% |
| Real estate listing monitoring | Grok Bot | Perplexity Comet | 31.5% |
| Job application submission | ChatGPT Agent | Gemini Agent Mode | 22.9% |
| Homework and study help | Gemini Agent Mode | ChatGPT Agent | 34.2% |
- We found that drop style commerce, meaning limited release tickets, sneakers, and restocks, is the most concentrated cluster in the consumer table, with Grok Bot leading all three categories at 38.7%, 41.2%, and 36.4%, which our researchers attribute to persistent agents being able to hold a queue position without the user present.
- Our data showed that Instinct leads four consumer categories, all of them involving a phone call or a contested charge, a concentration that followed its outbound calling release rather than preceding it.
- We observed that browser agents lead price sensitive tasks while personal assistants lead relationship tasks, a split our team did not anticipate when the study was designed and one that held across every month of the window.
Top AI Agents by Company Size
In the table below, we segment adoption by organization size, showing the leading and second place agent in each band alongside deployment depth and seat level spend.
The Top AI Agents by Company Size, 2026
| Organization Size | Leading Agent | Runner Up | Segment Share | Avg. Agents Deployed | Avg. Monthly Spend per Seat |
| Enterprise, 5,000+ employees | Microsoft 365 Copilot | Salesforce Agentforce | 24.7% | 4.6 | $82 |
| Upper mid market, 1,000 to 4,999 | GitHub Copilot Agent | Claude Code | 19.3% | 3.8 | $74 |
| Mid market, 200 to 999 | Claude Code | ChatGPT Agent | 21.4% | 2.9 | $61 |
| Small business, 20 to 199 | ChatGPT Agent | Cursor | 29.6% | 1.9 | $47 |
| Micro and solo, under 20 | ChatGPT Agent | Instinct | 38.4% | 1.3 | $29 |
- We found that agent count per organization scales with headcount while spend per seat does not, with enterprises running 4.6 agents at $82 per seat against 1.3 agents at $29 per seat among solo operators.
- Our data showed that Microsoft 365 Copilot leads only the largest band, where existing licensing and compliance review favor an incumbent vendor, and falls to fourth among companies under 200 employees.
- We observed that the upper mid market is the only segment where a coding agent leads overall, which our researchers attribute to engineering headcount forming a larger share of total staff in companies at that scale.
Requesting a Copy of This Report
If you would like a PDF copy of this report, or want to learn more about how our agency approaches generative engine optimization, you can reach out to us here. Related research from our team includes our agentic AI adoption statistics and our ranking of the top generative AI chatbots.re.