Since generative engine optimization (GEO) became a widely discussed subject in 2024, a common view has held that AI platforms favor highly structured websites, such as those that use schema markup, FAQ sections, and llms.txt files. Our research team set out to measure whether structured data affects which companies AI platforms rank and recommend.
Between June 8 and September 18, 2026, we ran 4,213 commercial prompts, such as “best payroll software for restaurants” and “top personal injury law firms in Houston,” through ChatGPT, Google Gemini (including AI Mode in Google Search), and Claude, and assigned AI agents 657 shortlisting and purchasing tasks. We refer to the first as standard AI search, in which a person asks a question and reviews the answer, and to the second as agentic search. For each of the 1,089 brands that surfaced across 14 industries, we audited data structure (schema markup, page formatting, and machine-readable files), scored the clarity of its offerings on a 1 to 10 scale, and measured how consistently its core facts appeared across its own website and third-party sources. We then modeled each factor against recommendation rate, defined as the share of relevant commercial prompts in which an AI platform named the brand as a recommended option, while controlling for each brand’s authority signals.
Summary of Findings
- Data structure does not determine AI rankings. Schema markup’s increase in recommendation rate fell to 0.4 points once we controlled for authority, and FAQ schema and llms.txt files showed no measurable effect.
- Clarity (of service offerings, software features, or product specifications) is a prerequisite, the same as it was for Google long before ChatGPT launched in late 2022. Recommendation rate doubled once a brand’s offerings and suitability became clear, then leveled off regardless of further structural work such as added schema markup.
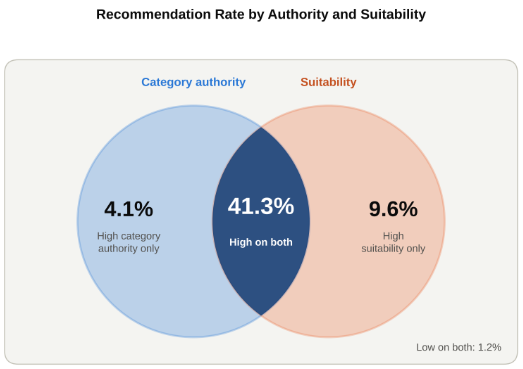
- Recommendation is a function of authority overlapping with suitability. Brands with high authority in their category but low suitability for the specifics (specialty, feature, or use case) named in a prompt were recommend just 4.1% of the time, compared with 41.3% when both were high.
- Consistency of information across a brand’s website and a diversity of third-party sources matters far more than markup, and its effect is largest in agentic search.
- Structured data carries weight in only two places: ecommerce product data, and the facts AI agents need to complete a task for a user, e.g. pricing, availability, hours, and booking information.
In the sections below, we break down the data behind each finding.
Impact of Structured Data Factors on AI Recommendation Rate
In the table below, we compare the average AI recommendation rate of brands with and without each factor, from schema markup and llms.txt files to the clarity and consistency of brand information. The final column shows how much of each difference remains once we control for authority signals such as list mentions, reviews, and awards. The product schema row is limited to the 214 ecommerce brands in our sample.
Impact of Structured Data Factors on AI Recommendation Rate
September 2026
| Factor | Share of Brands | AI Recommendation Rate With Factor | AI Recommendation Rate Without Factor | Increase (Before Accounting for Authority) | Increase (After Accounting for Authority) |
| Clear offerings and suitability (clarity score 7+) | 66% | 24.1% | 8.3% | +15.8 pts | +11.2 pts |
| Consistent brand information (site and third parties) | 36% | 29.6% | 12.7% | +16.9 pts | +9.4 pts |
| Comparison tables on service pages | 40% | 22.7% | 16.0% | +6.7 pts | +1.9 pts |
| Schema markup (any type) | 41% | 20.9% | 17.2% | +3.7 pts | +0.4 pts |
| Organization schema | 29% | 20.2% | 18.1% | +2.1 pts | +0.2 pts |
| FAQ schema | 22% | 19.3% | 18.5% | +0.8 pts | -0.3 pts |
| llms.txt file | 13% | 19.4% | 18.6% | +0.8 pts | -0.1 pts |
| Product schema (ecommerce brands only) | 71% | 26.4% | 19.7% | +6.7 pts | +4.8 pts |
Plotting each factor’s increase before and after accounting for authority shows how much of the apparent effect of structure belongs to authority.
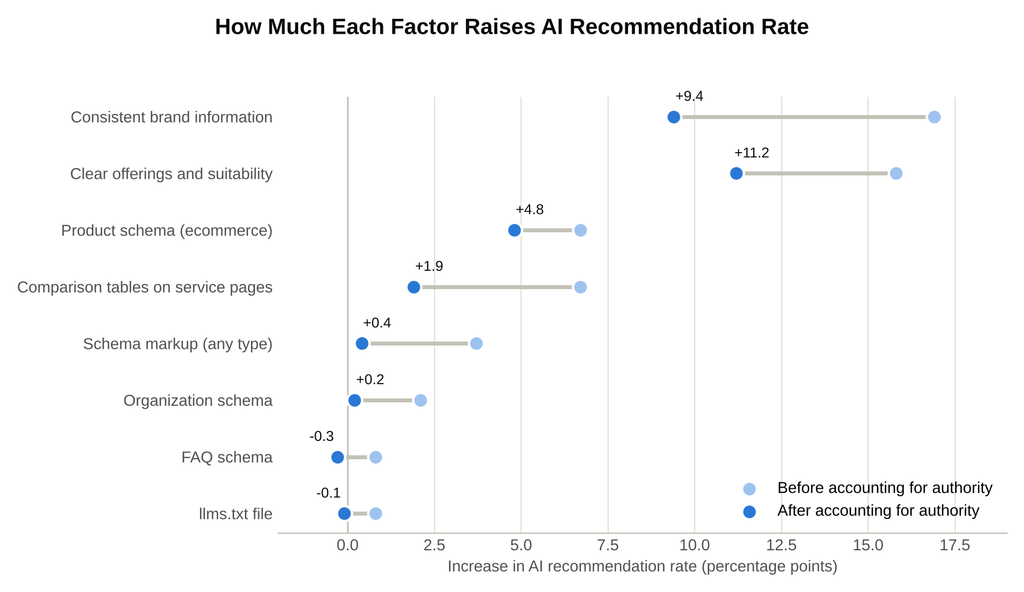
Our researchers took three points from this data:
- We found that schema markup raised recommendation rate by 3.7 points on its face, but by only 0.4 points once authority was held constant. Brands that invest in schema tend to be stronger on authority signals as well, and those signals account for most of the difference.
- FAQ schema and llms.txt files showed no measurable effect after accounting for authority, at -0.3 and -0.1 points respectively.
- The two factors that held up were clarity of offerings (+11.2 points) and consistency of brand information (+9.4 points). Product schema for ecommerce brands was the only markup type with a meaningful increase after accounting for authority, at +4.8 points.
Clarity Threshold vs Structural Optimization
Clarity, as we scored it, measures how plainly a site states what it offers, whom each offering suits, and in which situations. It is the same clarity a well-run website has always used to serve human readers, with tables, headings, and bullet points where they aid comprehension. Our analysts scored every brand’s website on four criteria: how plainly it states its offerings, how explicitly it states whom each offering fits, how many concrete specifics and proof points it gives, and how well it is organized. In the table below, we describe what a website looks like at each level of the scale.
Clarity Scale Criteria
| Score | Level | Offering Statement | Fit and Suitability | Specifics and Proof | Organization |
| 1 to 2 | Obscured | Homepage leads with slogans or generic, unedited AI-written copy; what the company sells is unclear | No mention of whom the company serves | None; only claims such as “innovative solutions” and “best-in-class service” | Disorganized navigation; offerings scattered or buried on a single page |
| 3 to 4 | Vague | Offerings named in the menu but described in broad terms | Audience described generically, such as “businesses of all sizes” | Few details; process, pricing approach, and results absent | Pages exist but read as long blocks of text without clear headings |
| 5 to 6 | Partial | Each offering described clearly on its own page | Fit implied through client logos or case studies but never stated outright | Some details and a case study or two, but key facts such as pricing approach or service area missing | Clear headings, but details and comparisons hard to scan |
| 7 to 8 | Clear | Homepage states plainly what the company does and for whom | Explicit statements of the customer types, use cases, and situations each offering suits | Concrete facts such as pricing approach, process, locations, and results with numbers | Headings, bullets, and tables make offerings and fit easy to scan |
| 9 to 10 | Comprehensive | Every offering defined, including how it differs from alternatives | Dedicated pages for each customer type, use case, and situation, including sub-types | Detailed facts and proof for each niche, such as statistics, awards, and client examples | Comparison tables and niche hubs connect every offering to every fit |
The difference between a 6 and a 7 is rarely design or markup. It comes down to whether the website says outright whom each offering is for and backs that up with concrete facts. In the table below, we break down the share of brands at each level and their AI recommendation rate.
AI Recommendation Rate by Clarity Score
September 2026
| Clarity Score | Level | Share of Brands | AI Recommendation Rate |
| 1 to 2 | Obscured | 4% | 2.1% |
| 3 to 4 | Vague | 11% | 5.6% |
| 5 to 6 | Partial | 19% | 11.2% |
| 7 to 8 | Clear | 38% | 23.6% |
| 9 to 10 | Comprehensive | 28% | 24.8% |
A score of 7 marks the line at which a website becomes clear enough for AI platforms to recommend it with confidence. Below the line, a brand is rarely recommended regardless of its other strengths. Above it, a brand competes on authority and suitability.
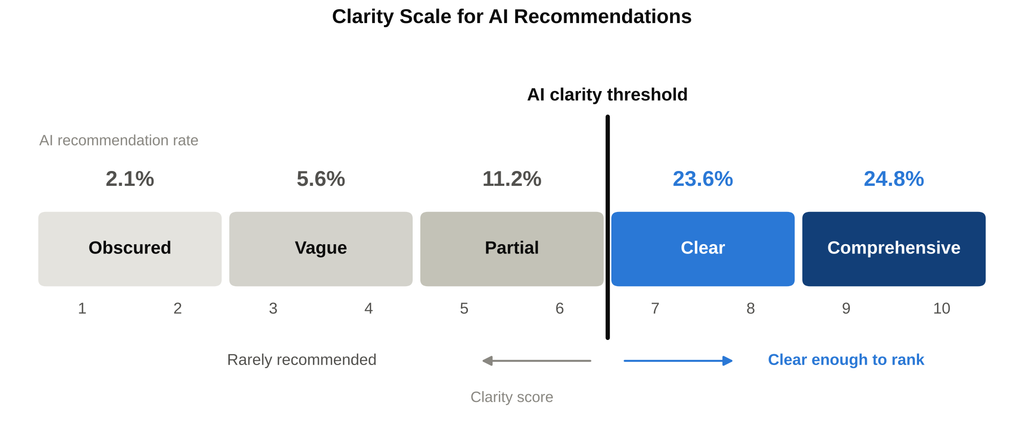
Recommendation rate more than doubled between the 5 to 6 band and the 7 to 8 band, then leveled off. To test whether additional structural work moves a brand past that plateau, we isolated the 66% of brands scoring 7 or higher and grouped them by structural optimization level. By structural optimization, we mean machine-readable markup added on top of a clear site, such as schema types, FAQ blocks, and llms.txt files, as distinct from the headings, tables, and bullet points that make a site clear to people.
AI Recommendation Rate by Structural Optimization Level Among High-Clarity Brands
September 2026
| Optimization Level | Typical Implementation | Share of High-Clarity Brands | Average Schema Types Deployed | AI Recommendation Rate |
| Minimal | No schema markup | 51% | 0.0 | 24.2% |
| Moderate | One or two schema types | 24% | 1.6 | 23.8% |
| Heavy | Three to five schema types, FAQ blocks | 17% | 3.8 | 24.4% |
| Intensive | Six or more schema types, FAQ blocks, llms.txt | 8% | 6.9 | 23.9% |
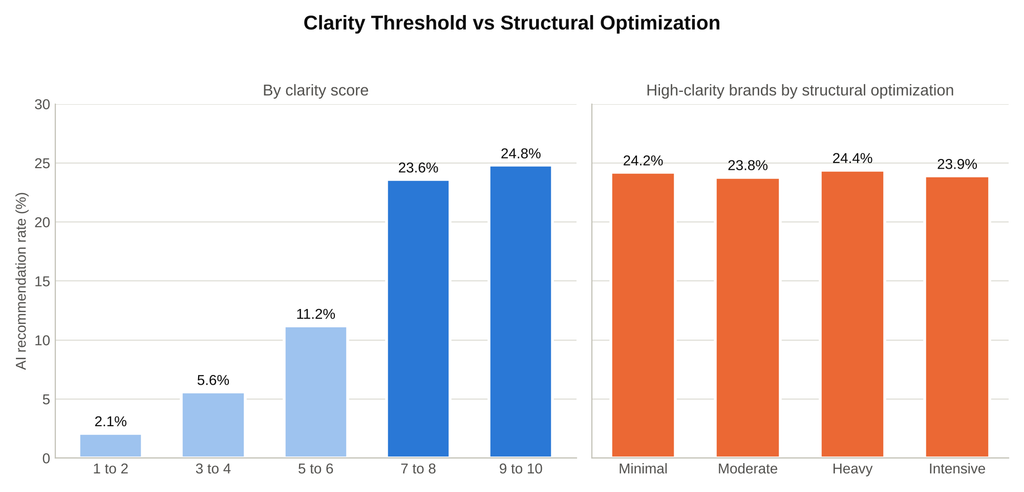
These are the conclusions our team drew from the clarity data:
- We found that moving from a clarity score of 5 to 6 up to 7 to 8 lifted recommendation rate from 11.2% to 23.6%, the largest single step in our dataset.
- Above a score of 7, recommendation rate barely moved, rising only to 24.8% for brands scoring 9 to 10.
- Among high-clarity brands, those running six or more schema types plus FAQ blocks and an llms.txt file were recommended at 23.9%, slightly below brands with no schema at all (24.2%).
Impact of Authority and Suitability on AI Recommendations
Clarity makes a brand’s suitability legible, but suitability alone does not earn a recommendation. In our GEO algorithm research, ChatGPT’s weighting is built entirely on authority signals: authoritative list mentions (41%), awards, accreditations, and affiliations (18%), online reviews (16%), customer examples and usage data (14%), and social sentiment (11%). What this study adds is that authority only translates into a recommendation when it overlaps with suitability. An AI platform asks whether a brand is authoritative in its category, and separately whether the brand is suitable for the niche in the prompt. By niche, we mean the specific specialty, feature, use case, or customer type a searcher names, such as a law firm’s practice area, a software product’s capability, or the type of business a service provider caters to.
To measure this, we isolated 3,126 brand and prompt pairs in which the prompt named a niche, such as a customer type (“best payroll software for restaurants”), a feature (“best CRM with built-in call recording”), or a specialty (“best personal injury law firm for trucking accidents”). We scored category authority using the weighted signals above. We scored suitability on two components: whether the brand’s own website claimed the niche and addressed it in depth, and whether a diversity of independent third-party sources confirmed that the brand serves it. In the table below, we break down recommendation rate by the overlap of category authority and suitability.
AI Recommendation Rate by Category Authority and Suitability
September 2026
| Category Authority | Low Suitability | Moderate Suitability | High Suitability |
| Low | 1.2% | 4.8% | 9.6% |
| Moderate | 2.9% | 12.4% | 24.7% |
| High | 4.1% | 19.8% | 41.3% |
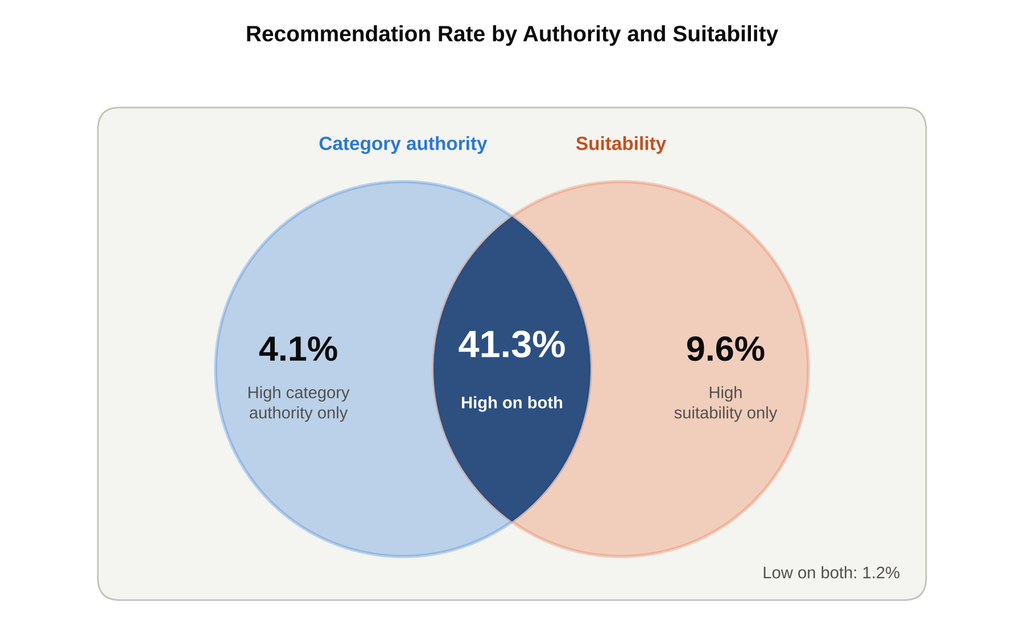
The first component of suitability is the on-site claim. In the table below, we break down recommendation rate for niche-specific prompts by how directly each brand’s website addressed the niche. The highest level of coverage includes the niche’s sub-types, such as a payroll provider speaking separately to quick-service restaurants, fine dining, and multi-location restaurant groups.
AI Recommendation Rate by On-Site Niche Coverage
September 2026
| On-Site Niche Coverage | Share of Brand and Prompt Pairs | AI Recommendation Rate |
| Niche not mentioned | 31% | 5.4% |
| Niche mentioned in passing | 27% | 11.9% |
| Dedicated niche page | 26% | 22.6% |
| Dedicated niche page addressing sub-types | 16% | 27.7% |
The second component of suitability is off-site confirmation. Among brands with high category authority, we compared recommendation rate for niche-specific prompts by whether independent sources confirmed the niche, said nothing about it, or placed the brand in a different niche altogether, such as describing a payroll provider as built only for healthcare employers.
AI Recommendation Rate by Third-Party Categorization Among High-Authority Brands
September 2026
| Third-Party Categorization | Share of High-Authority Brands | AI Recommendation Rate |
| Sources confirm the niche | 44% | 47.3% |
| Sources silent on the niche | 31% | 15.2% |
| Sources conflict on the niche | 16% | 9.8% |
| Sources place the brand in a different niche | 9% | 2.7% |
Our team drew three conclusions from the authority and suitability data:
- We found that brands with high category authority but low suitability were recommended in just 4.1% of niche-specific prompts, compared with 41.3% when high category authority overlapped with high suitability.
- On the website side, brands with a dedicated page for the niche that addressed its sub-types were recommended at 27.7%, more than five times the rate of brands that never mentioned the niche (5.4%).
- Brands whose third-party sources placed them in a different niche were recommended at only 2.7% for the niche in question, despite high category authority. When independent sources categorize a brand incorrectly, no amount of category authority overcomes it.
Impact of Information Consistency on AI Recommendations
We scored consistency by comparing each brand’s core facts, including what it offers, whom it serves, pricing, locations, and its claims of leadership, across its own website and an average of 37 third-party sources per brand, such as directories, review platforms, list articles, and press coverage. In the table below, we break down recommendation rate in standard AI search and shortlist rate in agentic tasks by consistency level.
AI Recommendation Rate by Consistency Level
September 2026
| Consistency Level | Share of Brands | Standard AI Search Recommendation Rate | Agentic Search Shortlist Rate |
| Very low | 12% | 5.9% | 2.8% |
| Low | 21% | 10.8% | 7.1% |
| Moderate | 31% | 16.6% | 15.3% |
| High | 22% | 26.2% | 31.7% |
| Very high | 14% | 34.9% | 46.2% |
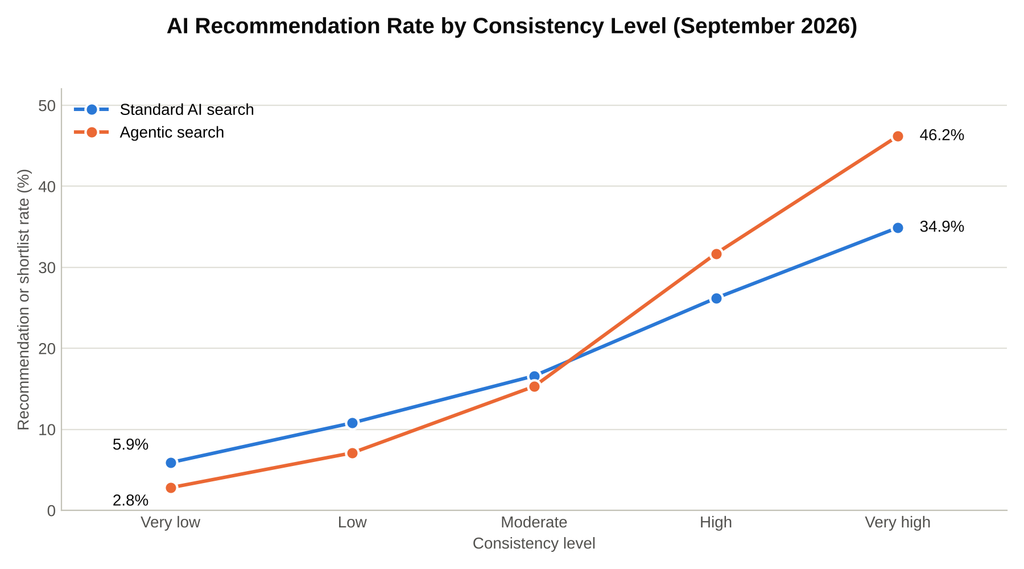
Consistency on a brand’s own site and consistency across third parties did not count equally. In the table below, we separate the two.
AI Recommendation Rate by Consistency Profile
September 2026
| Consistency Profile | Share of Brands | Standard AI Search Recommendation Rate | Agentic Search Shortlist Rate |
| Consistent on site and across third parties | 36% | 29.6% | 37.3% |
| Consistent across third parties only | 15% | 17.1% | 15.8% |
| Consistent on site only | 27% | 13.7% | 9.6% |
| Inconsistent on site and across third parties | 22% | 8.4% | 7.3% |
Our researchers drew three findings from the consistency data:
- We found that brands with very high consistency were recommended in 34.9% of standard AI search prompts, nearly six times the rate of brands with very low consistency (5.9%).
- In agentic tasks, the gap widened to more than 16 times (46.2% vs 2.8%), as agents cross-checked facts before adding a brand to a shortlist.
- Consistency across third-party sources outweighed on-site consistency. Brands consistent only across third parties were recommended at 17.1%, compared with 13.7% for brands consistent only on their own site.
Impact of Machine-Readable Data in Agentic Search
AI agents differ from standard AI search in one important respect. After retrieving options, the agent evaluates them and decides which to put in front of the user, often while completing a task such as comparing prices or booking an appointment. In the table below, we break down agent shortlist rate by how each brand published the facts the agent needed, such as pricing, availability, hours, and booking information.
Agent Shortlist Rate by How Key Facts Were Published
September 2026
| Fact | Machine-Readable | Clear Text Only | Missing or Gated |
| Pricing | 31.4% | 22.8% | 9.7% |
| Availability or inventory | 34.2% | 21.5% | 8.1% |
| Hours and locations | 29.8% | 24.6% | 11.3% |
| Product specifications | 30.6% | 23.9% | 12.4% |
| Service areas or eligibility | 27.1% | 23.2% | 10.6% |
| Booking or checkout path | 36.8% | 19.4% | 6.2% |
Here is what our team took from the agentic data:
- We found that in five of six rows, the gap between clear text and missing information was larger than the gap between clear text and machine-readable data. An agent that cannot find a fact drops the brand far more often than one that finds it in plain prose.
- Machine-readable booking and checkout paths produced the largest increase from structured data, at 17.4 points over clear text alone.
- The same structured facts produced an average increase of 0.7 points in standard AI search, which indicates that structure carries weight mainly when an agent has to act.
What Determines AI Retrieval
Which brands get recommended is decided at retrieval, the stage at which an AI platform assembles the candidates it will present. To see where data structure sits relative to everything else, we modeled the relative influence of each factor on recommendation rate across all three platforms. In the table below, we break down that influence for standard AI search and agentic tasks.
Relative Influence on AI Retrieval by Factor
September 2026
| Factor | Standard AI Search | Agentic Search |
| Authoritative list mentions | 33.1% | 21.2% |
| Third-party affirmation of leadership | 12.9% | 9.9% |
| Awards, accreditations, and affiliations | 10.7% | 7.9% |
| Online reviews | 9.9% | 10.3% |
| Client roster and customer data | 7.9% | 8.4% |
| Social sentiment | 5.9% | 3.2% |
| Suitability | 9.6% | 13.8% |
| Information consistency | 5.2% | 12.6% |
| Content clarity | 3.4% | 6.3% |
| Schema and structured data | 0.9% | 4.6% |
| Technical accessibility | 0.5% | 1.8% |
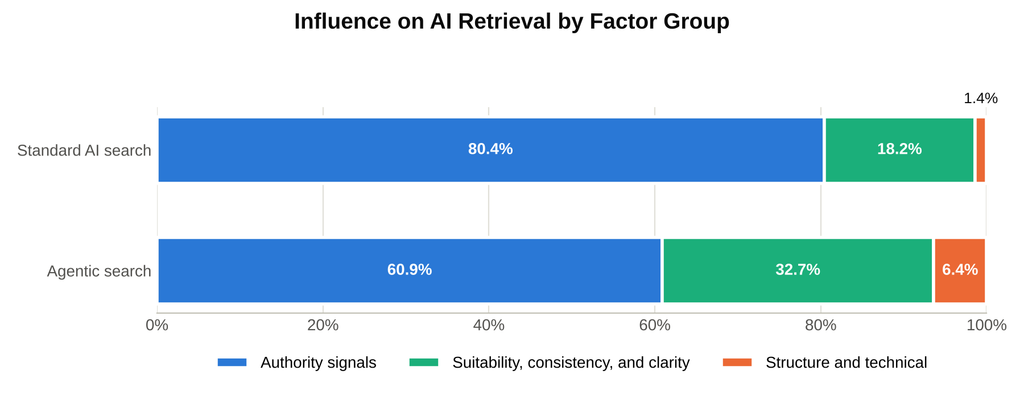
The shift in agentic search comes from an extra step. In standard AI search, the platform ranks the candidates and a person evaluates them, usually favoring the brands at the top. In agentic search, the agent evaluates the candidates itself before acting, checking whether each brand fits the request and whether its facts agree across sources. That check raises the weight of suitability, consistency, and clarity.
Technical accessibility ranked low because nearly every brand in our sample was crawlable. The 2.3% of brands that blocked AI crawlers or relied entirely on JavaScript rendering were recommended in just 3.1% of relevant commercial prompts.
Because list mentions carried the most influence, we also measured how much weight a single mention carried depending on who published the list and where it ranked on Google. In the table below, each source type is indexed to a mention on an independent list ranking in Google’s top five.
Weight of a List Mention by Source Type
September 2026
| Source Type | Relative Weight |
| Independent list, Google top 5 | 1.00 |
| Independent list, Google 6 to 10 | 0.71 |
| Self-published list, Google top 5 | 0.69 |
| Self-published list, Google 6 to 10 | 0.44 |
| Syndicated mention from a single press release | 0.27 |
| Self-published list, beyond Google page one | 0.06 |
Our researchers took three points from the retrieval data:
- We found that authority signals accounted for 80.4% of modeled influence in standard AI search, led by authoritative list mentions at 33.1%. Schema and structured data accounted for 0.9%.
- A self-published list ranking in Google’s top five carried 0.69 of the weight of an independent list. Those lists still count, but repeated affirmation from independent third parties is the more durable investment.
- In agentic search, suitability, consistency, and clarity together rose from 18.2% to 32.7% of influence, and structured data rose to 4.6%, as agents verified facts before acting on them.
Requesting a Copy of This Report
If you’d like to request a PDF copy of this report or learn more about our GEO services, you can reach out here.
- First Page Sage Research Study. First Page Sage. June to September 2026. San Francisco, California.
- AI Features and Your Website. Google Search Central. December 2025. Mountain View, California.
- Intro to How Structured Data Markup Works. Google Search Central. December 2025. Mountain View, California.
- GEO: Generative Engine Optimization. Aggarwal, P., Murahari, V., Rajpurohit, T., Kalyan, A., Narasimhan, K., and Deshpande, A. Princeton University. November 2023. Princeton, New Jersey.
- Generative Engine Optimization: How to Dominate AI Search. Chen, M., Wang, X., Chen, K., and Koudas, N. University of Toronto. September 2025. Toronto, Ontario.
- Top Ways to Ensure Your Content Performs Well in Google’s AI Experiences on Search. Google Search Central. May 2025. Mountain View, California.
- Creating Helpful, Reliable, People-First Content. Google Search Central. October 2026. Mountain View, California.
- Google Users Are Less Likely to Click on Links When an AI Summary Appears in the Results. Chapekis, A., and Lieb, A. Pew Research Center. July 2025. Washington, D.C.
- Introducing ChatGPT Search. OpenAI. October 2024. San Francisco, California.
- Introducing ChatGPT Agent: Bridging Research and Action. OpenAI. July 2025. San Francisco, California.