When an AI platform recommends a company, people often leave the conversation and find that company on their own. They type its web address into the browser, or they search for its name. Website analytics tools record those visits with no connection to the AI answer that prompted them. We refer to these visits as dark AI traffic.
From November 12, 2025 to November 3, 2026, our research team ran two studies to measure how much of this traffic exists. In a desktop panel study, we observed 16,113 AI searches and tracked where commercial clicks went after a buying opportunity, such as a company, software product, hotel, or restaurant, was presented. We then analyzed 46.9 million sessions across 218 websites.
Summary of Findings
- Click-throughs from AI platforms made up only 13.7% of downstream clicks from commercial searches.
- Searchers reached the brand on their own more often: 52.1% of downstream clicks were brand-name searches and 18.2% were direct URL type-ins.
- This equals 5.13 potentially dark visits for every identifiable AI visit.
- Across all 46.9 million sessions, we estimate that dark AI traffic made up 5.4% of total website traffic, about 5.1 times the 1.05% estimated for identifiable AI referral traffic.
In the sections below, we break down where AI searchers go after a recommendation, how many visits go unattributed, and how much of total website traffic dark AI traffic represents. The Methodology section at the end of this report details the composition of both studies.
Where AI Searcher Go After a Recommendation
Our panel study followed the next click after a person saw a buying opportunity in an AI answer. Buyers now use AI platforms across most major industries, so these paths affect a wide range of companies. In the table below, we break down where those clicks went and how each path typically appears in website analytics.
Where AI Searchers Go After a Recommendation (November 2025 to November 2026)
| Next Step After the AI Recommendation | Share of Downstream Clicks | How the Visit Typically Appears in Analytics |
| Searched the brand name in a browser | 52.1% | Organic or paid search |
| Typed the brand URL directly | 18.2% | Direct |
| Clicked through from the AI platform | 13.7% | AI referral |
| All other downstream clicks | 16.0% | Varies |
| Total | 100.0% |
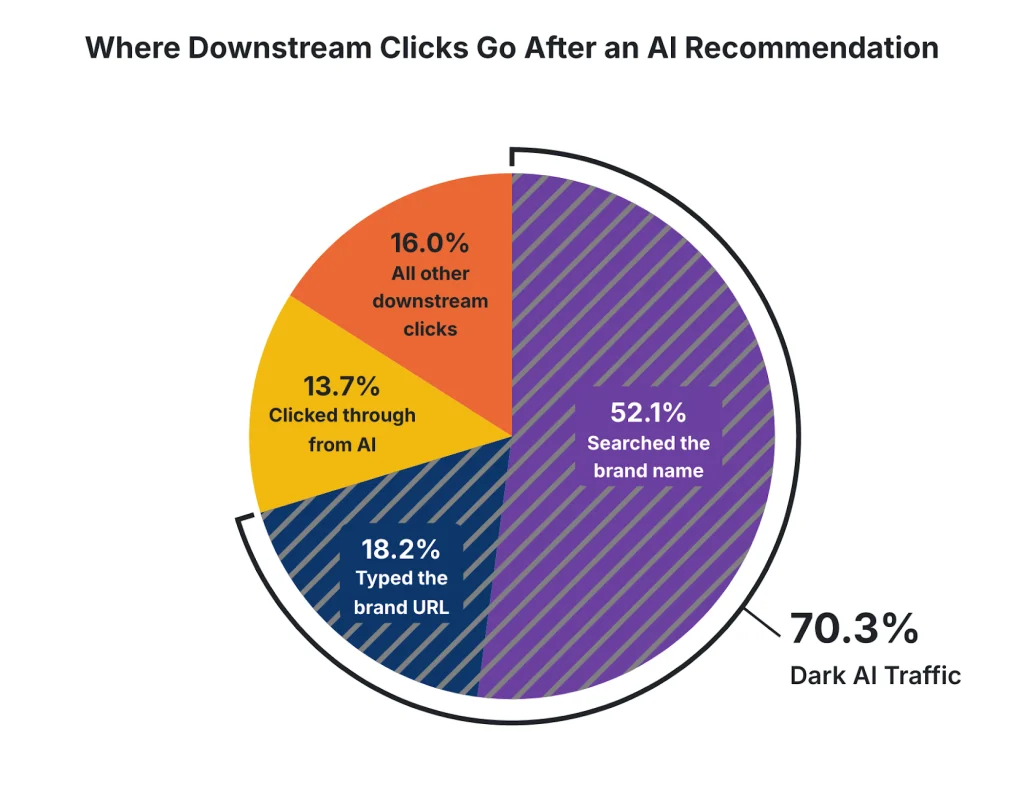
Our team took three main points from this data:
- We found that a brand-name search was the most common next step, at 52.1% of downstream clicks. Analytics tools typically credit these visits to organic or paid search.
- Our data showed that 18.2% of downstream clicks were direct URL type-ins, which analytics tools report as Direct traffic.
- Our researchers found that click-throughs made up only 13.7% of downstream clicks, in part because a link to the brand website was not always available or obvious in the AI answer.
Potentially Dark Visits per Identifiable AI Visit
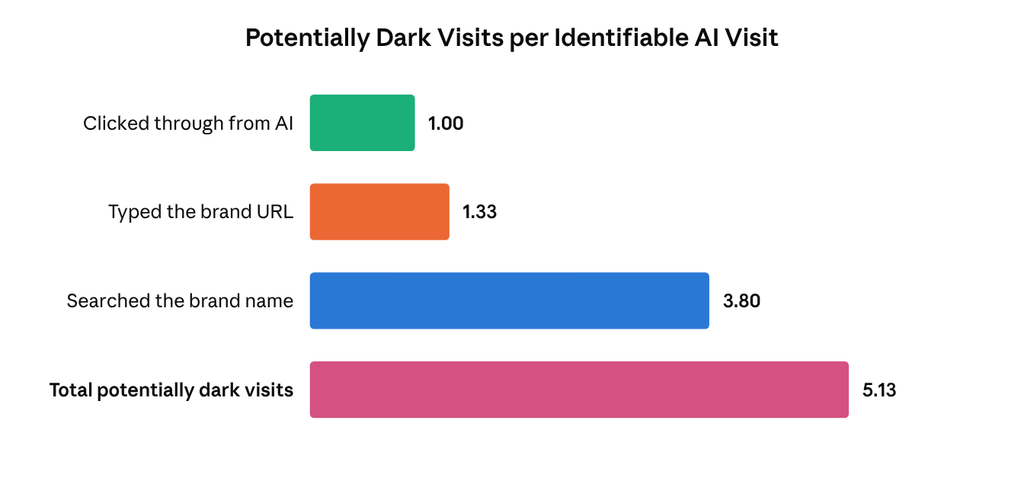
An identifiable AI visit is one that analytics tools can trace to an AI platform, which in our panel study means a click-through. To compare the other paths against that baseline, we divided each path’s share of downstream clicks by the 13.7% click-through share. In the table below, we show how many potentially dark visits accompany each identifiable AI visit.
Potentially Dark Visits per Identifiable AI Visit (November 2025 to November 2026)
| Path to the Brand | Share of Downstream Clicks | Visits per Identifiable AI Visit |
| Clicked through from the AI platform (identifiable) | 13.7% | 1.00 |
| Typed the brand URL directly | 18.2% | 1.33 |
| Searched the brand name in a browser | 52.1% | 3.80 |
| Total potentially dark visits | 70.3% | 5.13 |
Our team took three main points from this data:
- We found 5.13 potentially dark visits for every identifiable AI visit. A website that records 1,000 AI referrals from commercial searches could be receiving as many as 5,130 additional visits prompted by AI recommendations.
- Our data showed that brand-name searches account for 3.80 of those visits and direct URL type-ins account for 1.33.
- Our researchers found that 83.7% of clicks on the three paths leading to the brand left no AI referral in analytics.
Dark AI Traffic as a Share of Website Traffic
Our website study applied the behavior we observed in the panel study to total website traffic. Across 218 websites and 46.9 million sessions, we estimate that dark AI traffic was about 5.1 times the size of identifiable AI referral traffic. In the table below, we show the estimated size of each across the full dataset.
Dark AI Traffic as a Share of Website Traffic (November 2025 to November 2026)
| Traffic Type | Share of Total Website Sessions | Estimated Sessions |
| Dark AI traffic | 5.4% | 2,532,600 |
| Identifiable AI referral traffic | 1.05% | 492,450 |
| Combined AI-generated traffic | 6.45% | 3,025,050 |
These figures are estimates. Identifiable AI referral traffic was modeled from our downstream-behavior study, and dark AI traffic represents the AI-originated visits that conventional analytics attributes to direct or branded organic channels. Combined, AI-generated traffic made up approximately 6.45% of total website sessions. Companies measuring a generative engine optimization strategy by identifiable AI referrals alone will undercount its results.
Methodology
This report draws on two studies conducted from November 12, 2025 to November 3, 2026. In the table below, we summarize the sample used in each one.
Study Overview
| Study | Study Period | Sample |
| Desktop panel study | November 12, 2025 to November 3, 2026 | 16,113 AI searches |
| Website study | November 12, 2025 to November 3, 2026 | 46.9 million sessions across 218 websites |
We estimated dark AI traffic by combining conventional website analytics with our research into user behavior following commercial AI searches. Our research found that 18.2% of downstream actions involved directly entering a brand’s URL and 52.1% involved searching for the brand by name, compared with 13.7% involving identifiable AI click-throughs.
We used these proportions to estimate the AI-originated traffic that conventional analytics attributes to direct or branded organic channels. The 1.05% figure for identifiable AI referral traffic was also modeled from this research.
The sections below show how the 218 websites in the website study are composed.
Websites in the Study by Industry
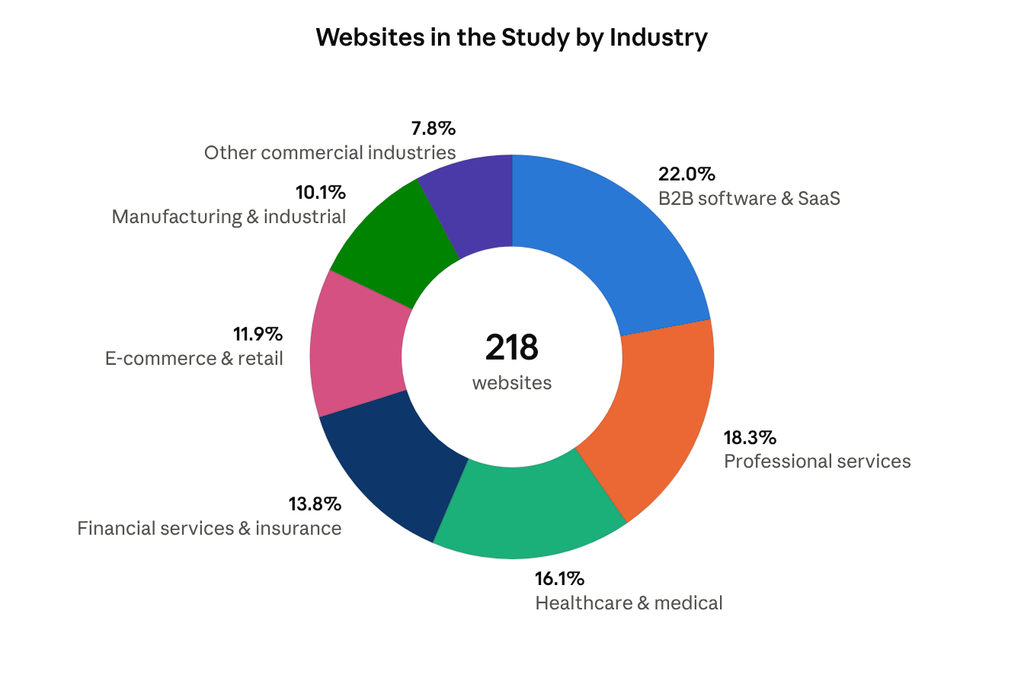
Our website study spans seven industry groups, so the 5.4% figure reflects a broad commercial sample. In the table below, we show how the 218 websites and 46.9 million sessions are distributed by industry.
Websites in the Study by Industry (November 2025 to November 2026)
| Industry | Websites | Annual Sessions | Share of Sites |
| B2B software & SaaS | 48 | 9.8M | 22.0% |
| Professional services | 40 | 7.4M | 18.3% |
| Healthcare & medical | 35 | 7.2M | 16.1% |
| Financial services & insurance | 30 | 6.6M | 13.8% |
| E-commerce & retail | 26 | 9.0M | 11.9% |
| Manufacturing & industrial | 22 | 4.1M | 10.1% |
| Other commercial industries | 17 | 2.8M | 7.8% |
| Total | 218 | 46.9M | 100% |
Our team took three main points from this data:
- We found that B2B software and SaaS was the largest group, with 48 websites and 22.0% of the sample.
- Our data showed that the three largest groups together account for 56.4% of the websites studied.
- Our researchers found that e-commerce and retail websites made up 11.9% of the sample but 19.2% of total sessions, the highest session volume per website of any group.
Websites in the Study by Size, Business Model, and Market
Website size, audience, and geography all shape how a traffic sample behaves, so we report each one separately. In the table below, we group the websites by their average monthly sessions.
Websites in the Study by Monthly Sessions (November 2025 to November 2026)
| Monthly Sessions per Website | Websites | Total Annual Sessions |
| Under 5,000 | 70 | 2.5M |
| 5,000 to 20,000 | 85 | 12.2M |
| 20,000 to 50,000 | 50 | 21.0M |
| Over 50,000 | 13 | 11.2M |
| Total | 218 | 46.9M |
Websites with 5,000 to 50,000 monthly sessions make up 61.9% of the sample and 70.8% of total sessions. The 13 largest websites account for 6.0% of the sample and 23.9% of sessions, so no single size group determines the overall result.
In the table below, we show the split between websites serving business buyers, consumers, or both.
Websites in the Study by Business Model (November 2025 to November 2026)
| Business Model | Websites | Share of Sites |
| B2B | 124 | 56.9% |
| B2C | 58 | 26.6% |
| Mixed | 36 | 16.5% |
| Total | 218 | 100% |
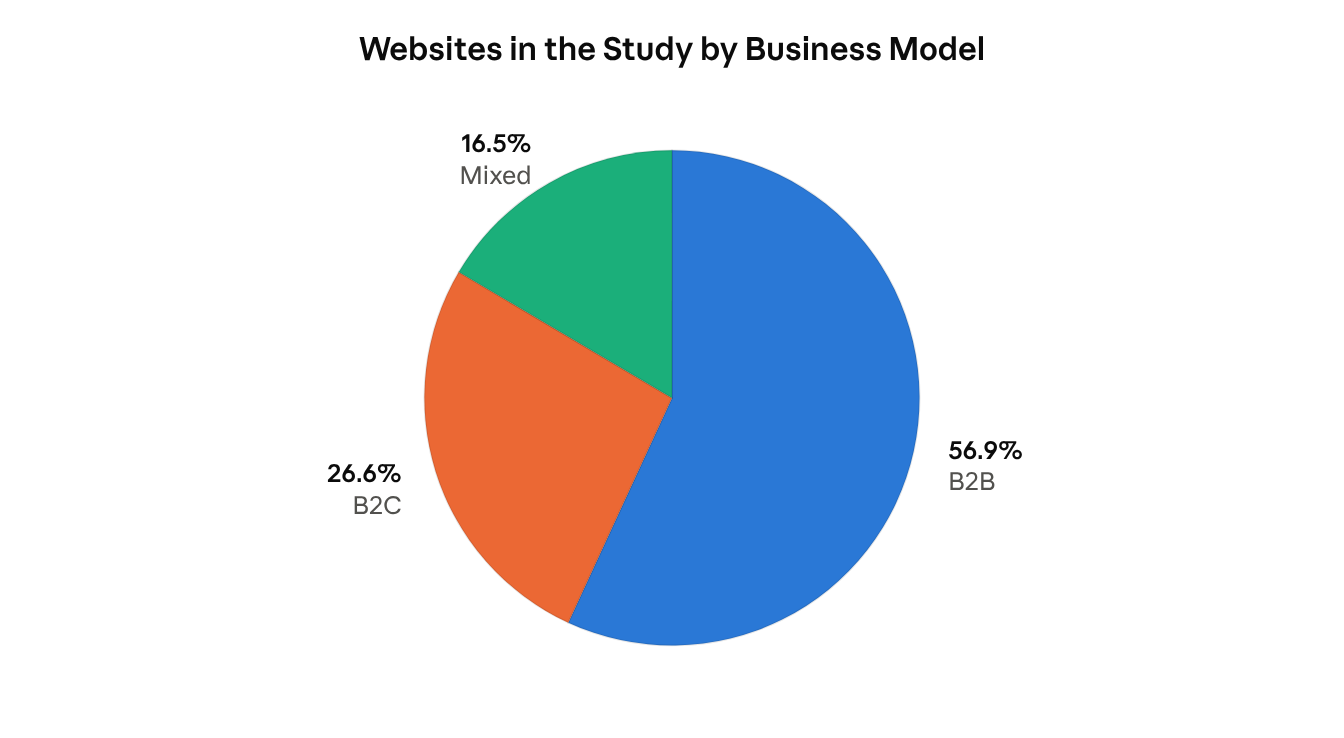
B2B websites form the majority of the dataset at 56.9%, and B2C and mixed websites together make up the remaining 43.1%.
In the table below, we show each website’s primary market.
Websites in the Study by Primary Market (November 2025 to November 2026)
| Primary Market | Websites | Share of Sites |
| United States | 175 | 80.3% |
| United Kingdom | 24 | 11.0% |
| Canada | 12 | 5.5% |
| Australia | 7 | 3.2% |
| Total | 218 | 100% |
The United States is the primary market for 80.3% of the websites studied. All four markets in the dataset are predominantly English-speaking, so these findings are most applicable to English-language search behavior.
Requesting a Copy of This Report
If you’d like to request a PDF copy of this report or learn more about our agency, you can reach out here.
- First Page Sage Research Study. First Page Sage, November 2025 – November 2026. San Francisco, California.
- Default Channel Group. Google. 2026. Mountain View, California.
- Custom Channel Groups. Google. 2026. Mountain View, California.
- Google Analytics Adds AI Assistant As Default Channel Group. Matt G. Southern, Search Engine Journal. May 2026. Online.