Between January 12 and April 18, 2025, our research team conducted a comprehensive analysis of sales pipeline velocity across 247 B2B organizations in North America. This study normalized data from our own client set, a private equity database, and three 3rd-party reports to establish benchmarks for sales velocity performance across different industry segments and company sizes.
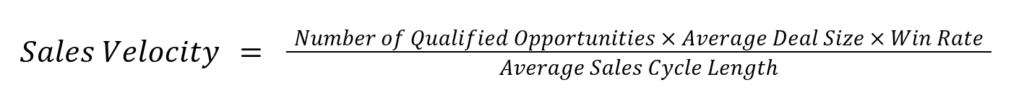
Sales pipeline velocity measures the speed at which qualified opportunities move through the sales funnel and generate revenue. The sales velocity formula we use is as follows:
Understanding sales pipeline velocity enables sales leaders to identify bottlenecks, optimize resource allocation, and accelerate revenue generation. Companies that focus on pipeline velocity metrics experience higher revenue growth compared to organizations that track traditional metrics alone.
In the sections below, we explore detailed benchmarks and breakdowns that reveal how top-performing organizations leverage velocity metrics to outpace their competition.
Sales Pipeline Velocity by Industry Segment
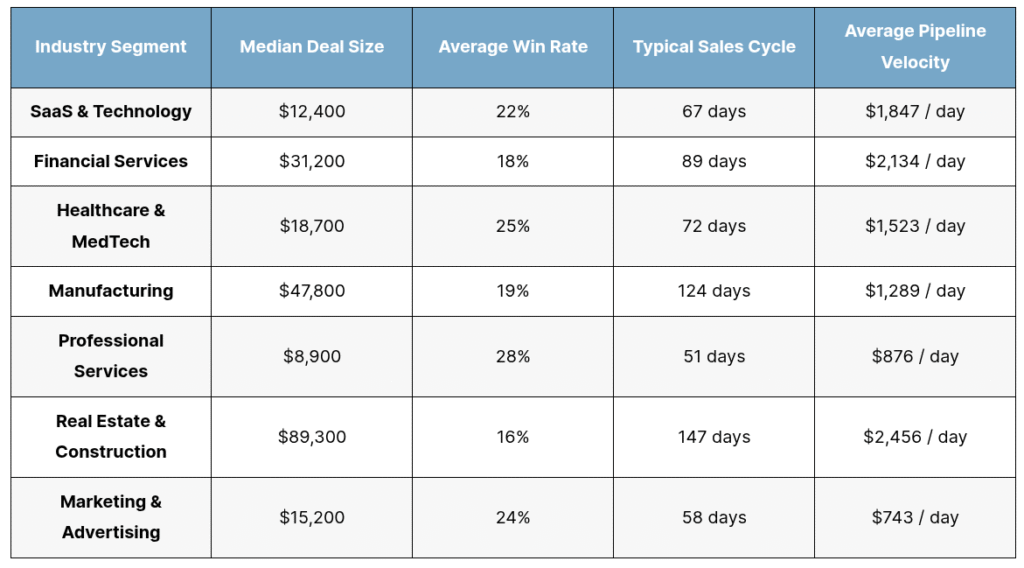
In the table below, we break down average daily sales velocity across major B2B industry segments based on our 2025 dataset.
Sales Pipeline Velocity by Industry Segment
| Industry Segment | Median Deal Size | Average Win Rate | Typical Sales Cycle | Average Pipeline Velocity |
| SaaS & Technology | $12,400 | 22% | 67 days | $1,847 / day |
| Financial Services | $31,200 | 18% | 89 days | $2,134 / day |
| Healthcare & MedTech | $18,700 | 25% | 72 days | $1,523 / day |
| Manufacturing | $47,800 | 19% | 124 days | $1,289 / day |
| Professional Services | $8,900 | 28% | 51 days | $876 / day |
| Real Estate & Construction | $89,300 | 16% | 147 days | $2,456 / day |
| Marketing & Advertising | $15,200 | 24% | 58 days | $743 / day |
Our researchers discovered that financial services and real estate lead in daily velocity despite longer sales cycles, primarily due to significantly higher average deal values. Technology companies achieve strong velocity through optimized conversion processes, while professional services excel with the highest win rates but smaller deal sizes. Manufacturing organizations face the longest sales cycles, requiring extended relationship-building periods for complex B2B transactions.
Sales Velocity Performance by Company Revenue Size
The following analysis examines how sales velocity varies across different company revenue segments, revealing distinct patterns in sales efficiency.
Sales Velocity Performance by Company Revenue Size
| Revenue Range | Qualified Opportunities | Average Deal Size | Win Rate | Sales Cycle Length | Average Pipeline Velocity |
| $1M–$5M | 18 | $6,200 | 26% | 43 | $687 / day |
| $5M–$25M | 27 | $12,800 | 23% | 61 | $1,303 / day |
| $25M–$100M | 57 | $22,700 | 21% | 78 | $3,484 / day |
| $100M—$500M | 98 | $35,300 | 19% | 95 | $6,919 / day |
| $500M+ | 156 | $57,600 | 17% | 118 | $12,945 / day |
Our analysis reveals that larger organizations generate substantially higher daily velocity through increased pipeline capacity and larger deal values, despite lower win rates and extended sales cycles. Smaller companies demonstrate higher conversion efficiency but struggle with pipeline volume and deal size limitations. Mid-market companies ($25M-$100M) represent the optimal balance, achieving strong velocity while maintaining reasonable win rates and manageable sales cycles.
Sales Cycle Optimization Impact on Velocity
This section explores the relationship between sales cycle length reduction and overall pipeline velocity improvements across our study participants.
Sales Cycle Length vs Velocity Performance
| Sales Cycle Length | Average Pipeline Velocity | Velocity Improvement | Deal Size Impact | Win Rate Change |
| 30–45 days | $2,134 / day | +38% | -$2,400 | +3% |
| 46–60 days | $1,687 / day | +21% | -$1,200 | +1% |
| 61–75 days | $1,456 / day | +8% | +$800 | -1% |
| 76–90 days | $1,289 / day | Baseline | Baseline | Baseline |
| 91–120 days | $1,087 / day | -15% | +$3,600 | -2% |
| 120+ days | $834 / day | -35% | +$7,200 | -4% |
Research findings indicate that organizations reducing their sales cycles to 30-45 days achieve 38% higher velocity, though this often comes with smaller average deal sizes. Companies with cycles exceeding 120 days experience significant velocity decreases despite pursuing larger opportunities. The optimal range appears to be 46-75 days, where organizations maintain strong velocity while preserving deal value and conversion rates.
Pipeline Velocity Tracking Frequency and Performance Correlation
Our study examined how different velocity tracking frequencies correlate with overall sales performance and revenue predictability.
Sales Velocity Tracking Frequency vs Performance Outcomes
| Tracking Frequency | Revenue Growth Rate | Forecast Accuracy | Pipeline Health Score | Team Performance Index |
| Weekly | 34% | 87% | 9.2/10 | 8.8/10 |
| Bi-weekly | 28% | 81% | 8.4/10 | 8.1/10 |
| Monthly | 22% | 74% | 7.6/10 | 7.3/10 |
| Quarterly | 16% | 68% | 6.8/10 | 6.7/10 |
| Ad-hoc | 11% | 52% | 5.1/10 | 5.9/10 |
Organizations implementing weekly velocity tracking demonstrate superior performance across all measured dimensions. These companies achieve 34% annual revenue growth compared to 11% for those with irregular tracking patterns. Weekly monitoring enables rapid identification of pipeline issues, resulting in 87% forecast accuracy versus 52% for irregular trackers. Our researchers attribute this performance gap to the proactive nature of frequent velocity analysis, allowing teams to address bottlenecks before they impact revenue generation.
Requesting a Copy of This Report
If you’d like to request a pdf copy of this report or learn more about our agency, you can reach out here.