Between June and September 2025, our research team surveyed 6,183 US adults to determine the percentage of people that used a generative AI platform to make a purchasing decision. We asked participants to identify the industries in which they used AI to make purchasing decisions, as well as to rate the impact of the purchases they explored using AI.
To define what a “purchasing decision” is, we used the following scale:
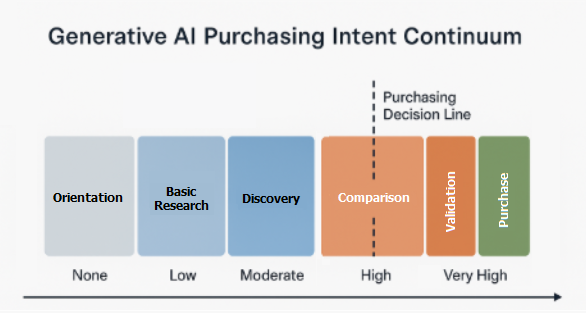
For example, participants that indicated they used an AI platform to “lightly compare products or services with the possibility of buying later” did not count as people using AI to make purchasing decisions. However, those that said they used an AI platform to “compare products or services with intention to buy” were counted, as well as those that told us they used AI in an even more purchase-oriented way.
The results of our survey are below, and our methodology is shared at the end of the report.
What Percentage of People Use AI to Make Purchasing Decisions?
The first series of questions in our survey sought to answer our overarching question: “Did U.S. adults use AI to make a purchasing decision in the last 90 days?” Here was the outcome:
Percentage of U.S. Adults Using AI to Make Purchasing Decisions
| Consumers | Business Decision Makers |
| 53% | 46% |
The implication of these results, which is that more than half of consumers and nearly half of business decision-makers used AI to make a buying-related decision in the last 90 days, is that AI has a much more significant impact on commerce than it did one year ago, when a similar survey indicated about ~9% of people were using AI to make a purchasing decision.
It’s clear that 2025 was the year when AI went from a research tool to a buying tool.
Which Industries Saw Their Customers Using AI to Make Purchasing Decisions?
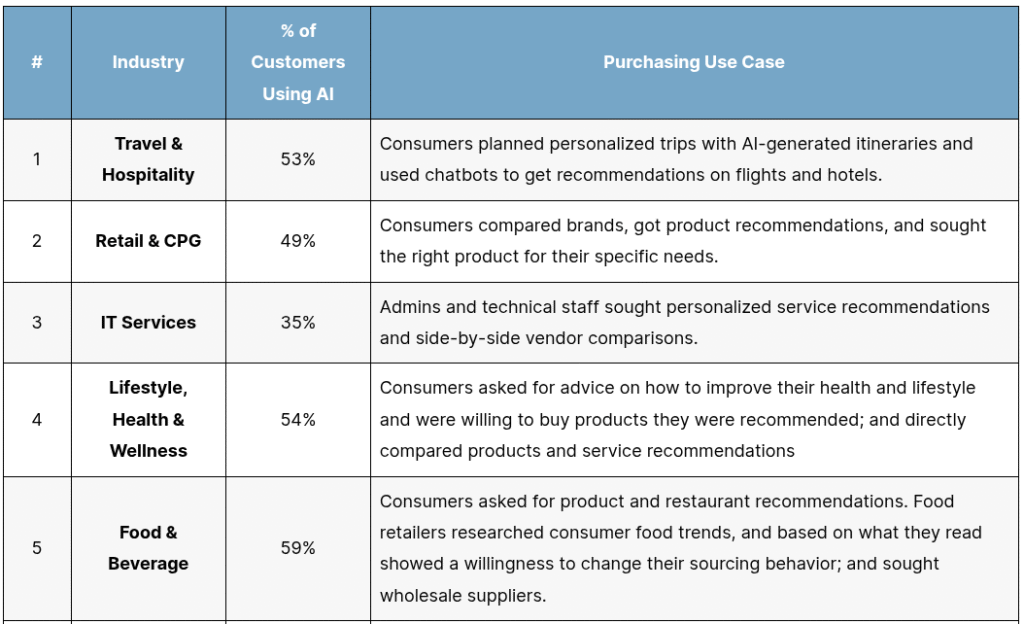
Our survey proceeded to ask the nature of respondents’ buying-related AI research – specifically, in which industries they used these tools to make purchasing decisions. Below, we broke down the responses we got as well as the purchasing use case within each industry.
Percentage of US Adults that Use AI to Make Purchasing Decisions, by Industry
| # | Industry | % of Customers Using AI | Purchasing Use Case |
| 1 | Travel & Hospitality | 53% | Consumers planned personalized trips with AI-generated itineraries and used chatbots to get recommendations on flights and hotels. |
| 2 | Retail & CPG | 49% | Consumers compared brands, got product recommendations, and sought the right product for their specific needs. |
| 3 | IT Services | 35% | Admins and technical staff sought personalized service recommendations and side-by-side vendor comparisons. |
| 4 | Lifestyle, Health & Wellness | 54% | Consumers asked for advice on how to improve their health and lifestyle and were willing to buy products they were recommended; and directly compared products and service recommendations |
| 5 | Food & Beverage | 59% | Consumers asked for product and restaurant recommendations. Food retailers researched consumer food trends, and based on what they read showed a willingness to change their sourcing behavior; and sought wholesale suppliers. |
| 6 | Home Services | 41% | Home services customers estimated costs and found local HVAC, plumbing, and pest control providers through AI platforms. |
| 7 | Healthcare | 44% | Consumers sought treatments based on symptoms; healthcare orgs find recommendations for the latest technology to modernize their office or department. |
| 8 | Automotive | 46% | Consumers used generative AI to quickly compare vehicles and narrow their search down to 2-3 models. On the B2B side, AI saw less use for purchasing as the automotive industry is primarily relationship-driven. |
| 9 | B2B SaaS | 41% | Decision makers compared platforms and sought out personalized software recommendations for their industry and use case. |
| 10 | Advertising & Marketing | 40% | Marketing decision-makers asked chatbots questions about which platforms and integrations they needed in order to build their martech stack. |
| 11 | Fintech | 39% | Consumers sought finance apps that suited their lifestyle and needs. Business owners validated existing financial solutions and compared tools. |
| 12 | Insurance | 37% | Business decision-makers and consumers researched which insurance solution is best for them and attempted to optimize pricing. |
| 13 | Real Estate | 31% | Investors analyzed neighborhoods and crunched numbers to make decisions about which properties to invest in. Consumers researched specific neighborhoods and residential communities. |
| 14 | Financial Services | 40% | Consumers and businesses both used generative AI to find and compare financial service providers. |
| 15 | Education | 61% | Prospective students researched the best programs to apply to for their interests and schedules. |
Do People Use AI to Make Impactful Purchases?
We also asked participants to predict the level of impact the purchases they researched on AI platforms would have on them. Below, we’ve segmented the data by magnitude of purchase impact, creating purchase impact categories for better comprehension. We also separated consumer results and business decision-maker (B2B) results.
Percentage of US Adults that Use AI to Make Purchasing Decisions, by Purchase Impact
| Level | Purchase Impact | Description | % | Purchase Impact | Description | % |
| B2C | B2B | |||||
| Low | Spontaneous Purchase | Impulsive, low-stakes, emotion-driven buys. Often for pleasure or novelty. Examples: candy, small décor, sale items. | 61% | Incidental Spend | Minor, unplanned expenses with little approval needed. Examples: team lunch, office supplies, low-cost SaaS add-on. | 52% |
| Moderate-Low | Considered Convenience | Quick but semi-rational decisions balancing need and desire. Examples: clothing, gadgets, home goods. | 51% | Tactical Purchase | Needed for daily operations but chosen with minimal research. Examples: marketing tools, software utilities, basic equipment. | 56% |
| Moderate | Functional Commitment | Medium- to high-cost items with some research and justification. Examples: laptop, furniture, travel, exercise equipment. | 52% | Operational Investment | Directly affects productivity or workflow; multiple stakeholders weigh in. Examples: CRM system, office tech, departmental tools. | 43% |
| High | Major Life Purchase | Big-ticket or emotionally meaningful items with long-term impact. Examples: car, home, major appliance, pet, wedding purchase. | 32% | Strategic Investment | High-value, multi-department decision that affects company direction. Examples: enterprise software, rebrand, automation platform. | 37% |
| Very High | Identity Investment | Deeply tied to self-image, aspirations, or major life changes. Examples: art, education, business ownership, sustainable living. | 29% | Transformational Decision | Redefines business trajectory, culture, or market position. Examples: M&A, platform overhaul, long-term agency partnership. | 35% |
Media Inquiries & Requesting a Copy of this Report
If you’d like to reach out to our team or request a pdf copy of this report, you can reach out here.