Last updated November 6, 2026
Our team has built more than 100 B2B corporate blogs, and in that work we measure every blog against the goals it was created to serve. The following report was compiled from client data and research from 2020 through November 2026.
A corporate blog typically has six goals: generating leads, supporting sales, demonstrating thought leadership, assisting other marketing, raising brand awareness, and building relationships. Below, we share the metrics and targets we use to judge each one, so you can see whether your blog is working and where to optimize it.
Corporate Blog Metrics by Goal
In the table below, we match each metric to the goals it measures and give the target we set for each pairing. A blank cell means the metric does not measure that goal well.
| Metric | Generates Leads | Supports Sales | Demonstrates Thought Leadership | Assists Other Marketing | Raises Brand Awareness | Builds Relationships |
| Blog Visits | At least 5% of total site traffic | +5% month over month after 4 months of consistent publishing | 25%+ of visitors view a second page | 10,000 visitors per month | ||
| Organic Traffic | Flat or up year over year | 1.9% of organic visitors become leads | 30% of new users arrive through organic search | 40%+ of total sessions are organic | 4.5%+ of organic visitors return within 90 days | 1 in 10 posts gains traffic over time |
| Average Views per Post | +10% month over month in a blog’s first year | +15% over a year | ||||
| Search Ranking Position | Top 3 for 5+ transactional keywords | Transactional organic sessions flat or up | Cited in AI answers for 5+ valuable keywords | Main blog page ranks in the top 3 | Branded search traffic +15% year over year | Referral traffic +5% month over month |
| AI Visibility | 7%+ of sessions from AI platforms | ChatGPT visitors convert to leads at 4.8%+ | Recommended by ChatGPT, Gemini, and Claude for core category queries | |||
| Conversion Rate | Cost per acquisition 10%+ below industry average | 3% to 5% conversion rate | Most conversions are quality leads | 10+ conversions per month | ||
| Comments per Social Media Post | 3+ relevant comments per post | 2+ non-spam comments per post | 50%+ of comments are positive | |||
| Returning Visitors | 16% of returning visitors convert | Returning visitors +5% after 6 months of consistent publishing | Visitors return after more than 6 months | 5 page views per returning visit | 20%+ of traffic is returning | |
| Social Shares per Post | Engagement rate above 3% | Click-through rate above 2% | 5+ shares per week | Posts reach 20% of total audience | 3+ LinkedIn shares per post | 3+ reposts per month from other pages or people |
| Inbound Links per Post | Inbound links lift referrals 5% | 40% of links come from an authoritative site | 1 unaffiliated reputable link is good, 2 to 3 is great, more than 3 is excellent | 2+ inbound links per month |
=Corporate Blog Metrics by Goal, 2026
Our team drew three conclusions from this framework:
- We review organic traffic first on any blog, because it is the most direct measure across all six goals.
- We see AI visibility supporting leads, sales, and thought leadership, the three goals closest to revenue.
- We suspect that social metrics say more about awareness and relationships than about pipeline.
Traffic and Visibility Targets
In the table below, we list the core target for each traffic and visibility metric and what that metric tells you about a blog.
Corporate Blog Traffic and Visibility Targets, 2026
| Metric | Core Target | What It Shows |
| Blog Visits | At least 5% of total site traffic | Whether posts target keywords buyers search |
| Organic Traffic | 40%+ of total sessions, flat or up year over year | How much of the blog’s audience comes from unpaid search |
| Average Views per Post | +15% over a year | Which posts perform best |
| Search Ranking Position | Top 3 for 5+ transactional keywords | Whether the blog reaches buyers on revenue-generating keywords |
| AI Visibility | 7%+ of sessions from AI platforms | Whether AI platforms recommend the company |
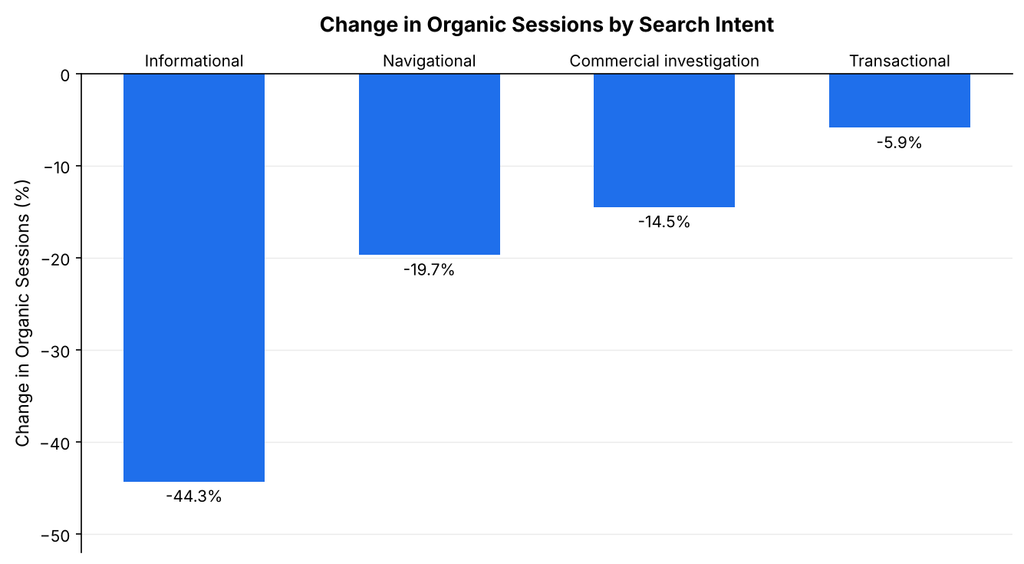
In the table below, we show how organic sessions changed by search intent from January 2023 to September 2026.
Change in Organic Sessions by Search Intent, 2026
| Search Intent | Change in Organic Sessions |
| Informational | -44.3% |
| Navigational | -19.7% |
| Commercial investigation | -14.5% |
| Transactional | -5.9% |
Our team drew three conclusions from our traffic research:
- We found that organic search delivers 42.2% of sessions across our client panel, which is why we set the organic target at 40%. Our AI impact research shows informational queries falling 44.3% and transactional queries falling 5.9%, so transactional rankings deserve the most attention.
- We see citations in AI answers as the clearest sign that a company is the source for a topic.
- Our dark AI traffic research found 5.13 potentially dark visits for every identifiable AI visit, and 52.1% of downstream clicks were brand-name searches. We read branded search growth as a sign of AI visibility as well as brand awareness.
Google Analytics includes an AI Assistant default channel, though some AI visits still land in other channels, so we recommend reviewing referrers by hand.
Engagement and Conversion Targets
In the table below, we list the core target for each engagement and conversion metric and what that metric tells you about a blog.
Corporate Blog Engagement and Conversion Targets, 2026
| Metric | Core Target | What It Shows |
| Conversion Rate | 3% to 5% | Whether readers take a valued action |
| Returning Visitors | 20%+ of traffic | Whether readers come back and move down the funnel |
| Comments per Social Media Post | 3+ relevant comments per post | Whether the right audience is engaging |
| Social Shares per Post | 5+ shares per week for B2B, much higher for B2C | How content performs once it leaves the blog |
| Inbound Links per Post | 1 link from an unaffiliated, reputable third party | Whether the blog is building relationships and authority |
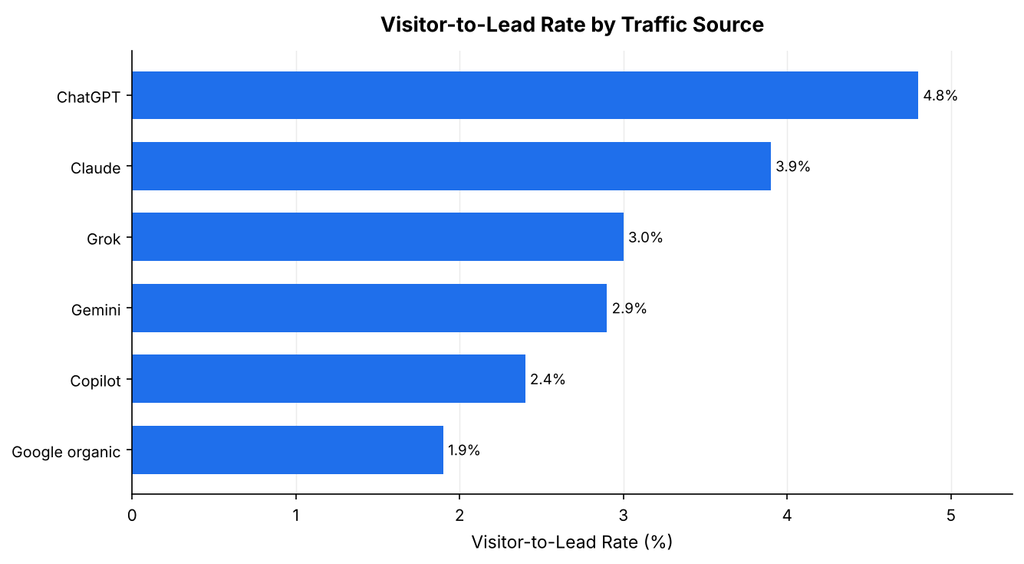
In the table below, we show how often visitors from each traffic source become leads.
Visitor-to-Lead Rate by Traffic Source, 2026
| Traffic Source | Visitor-to-Lead Rate |
| ChatGPT | 4.8% |
| Claude | 3.9% |
| Grok | 3.0% |
| Gemini | 2.9% |
| Copilot | 2.4% |
| Google organic | 1.9% |
Three notes on these targets:
- We count any valued action as a conversion, including a contact form, a call, a white paper download, or a webinar signup.
- We define a returning visitor as anyone who visited the site within the past two years. These readers are more likely to move down the funnel.
- We judge a link’s authority by a Moz or Ahrefs domain score, and aim for 40% of a blog’s links to come from authoritative sites.
Requesting a Copy of This Report
Quality and regularity are the two requirements of corporate blogging, and many companies hand blog production to a thought leadership agency so they can focus on their core business. If you would like a PDF copy of this report or want to learn more about our agency, you can contact us here.
- First Page Sage Research Study. First Page Sage. November 2026. San Francisco, California.
- AI Impact on Website Traffic: 2026 Report. First Page Sage. October 2026. San Francisco, California.
- Dark AI Traffic Statistics: November 2026. First Page Sage. November 2026. San Francisco, California.
- Conversion Rate Benchmarks in 2026. First Page Sage. November 2026. San Francisco, California.
- New vs. Returning Visitors: What’s a Healthy Split? (Benchmarks by Industry). Marianna Mankle, Siege Media. October 2026. Online.
- Default Channel Group. Google. 2026. Mountain View, California.
- How To Track AI Traffic In GA4 Without Undercounting It. Itamar Blauer, Search Engine Journal. July 2026. Online.