Last updated October 28, 2026
This report shares our Google Ad conversion rate data, compiled from 139 client accounts between 2018 and 2026. Our dataset included 87 primarily B2B companies, 28 primarily B2C companies, and 24 companies with a mixed customer base.
We use the same definition of Google Ad Conversion Rate provided by Google themselves: the number of conversions divided by the number of total ad interactions that can be tracked to a conversion during the same time period, or in other words:
Google Ad Conversion Rate = Number of Conversions Resulting From Ads ÷ Number of Ad Interactions
Using this definition, we found that for our dataset:
The average conversion rate for Google Ads is 4.8%.
The overall average conversion rate is of limited utility, however, given that per-industry averages range from 1.7% (for IT & Managed Services) to 6.6% (for HVAC). In the sections below, we break down the data by industry, by year, and by customer type.
Google Ad Conversion Rate by Industry
In the table below, we break down the average Google Ad conversion rate for each of the 19 industries in our dataset, aggregated across all accounts from 2018 to 2026.
The Google Ad Conversion Rate by Industry, 2026
| Industry | Google Ad Conversion Rate |
| Addiction Treatment | 2.2% |
| Automotive | 3.7% |
| Biotech | 2.2% |
| Business Insurance | 4.0% |
| Construction | 2.0% |
| eCommerce | 2.9% |
| Financial Services | 2.5% |
| Fintech | 2.8% |
| Healthcare | 5.6% |
| Heavy Equipment | 1.8% |
| Higher Education | 2.4% |
| HVAC | 6.6% |
| Industrial IOT | 3.5% |
| IT & Managed Services | 1.7% |
| Law Firms & Legal Services | 4.1% |
| Manufacturing & Distribution | 2.1% |
| Medical Device | 2.4% |
| Oil & Gas | 1.9% |
| SaaS | 2.5% |
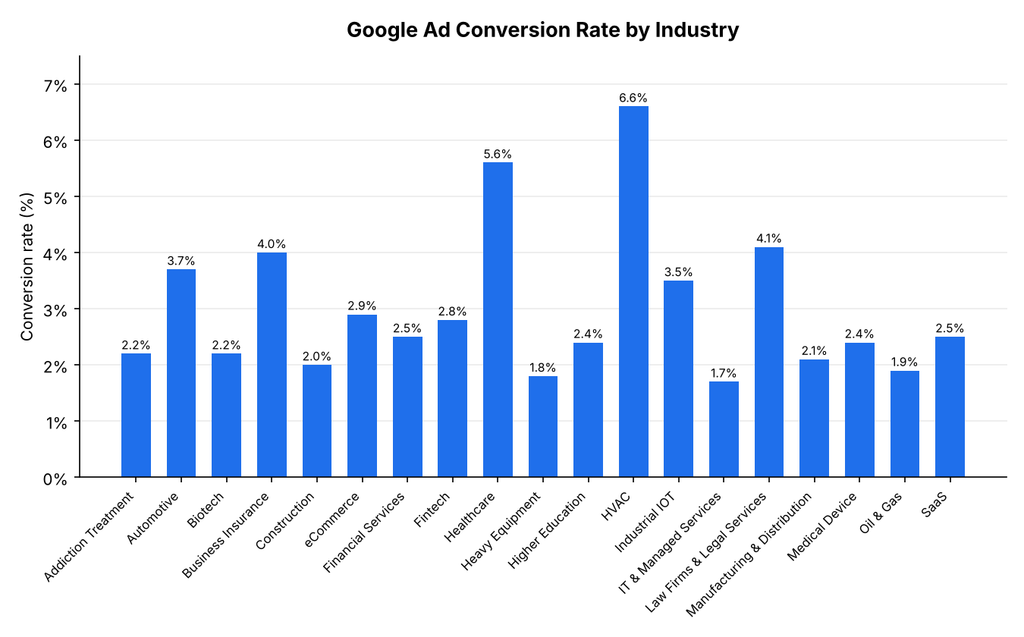
- We found that HVAC (6.6%) and Healthcare (5.6%) posted the highest conversion rates in our dataset, and the two industries also generated 56% of all tracked ad interactions, which is why the weighted average sits at 4.8%.
- Our data showed that 13 of the 19 industries converted below 3%, led at the low end by IT & Managed Services (1.7%), Heavy Equipment (1.8%), and Oil & Gas (1.9%), categories that in our experience tend to have longer, multi-stakeholder sales cycles.
- We observed that HVAC accounts converted at nearly 3.9 times the rate of IT & Managed Services accounts, the widest spread between any two industries in our analysis.
Google Ads Conversion Rate Over Time, 2018 to 2025
In the table below, we show the average Google Ads conversion rate across all accounts in our dataset for each full calendar year of the study, weighted by ad interactions.
The Google Ads Conversion Rate Over Time, 2018 to 2025
| Year | Average Google Ads Conversion Rate |
| 2018 | 4.4% |
| 2019 | 4.6% |
| 2020 | 5.0% |
| 2021 | 4.7% |
| 2022 | 4.8% |
| 2023 | 4.9% |
| 2024 | 4.8% |
| 2025 | 5.0% |
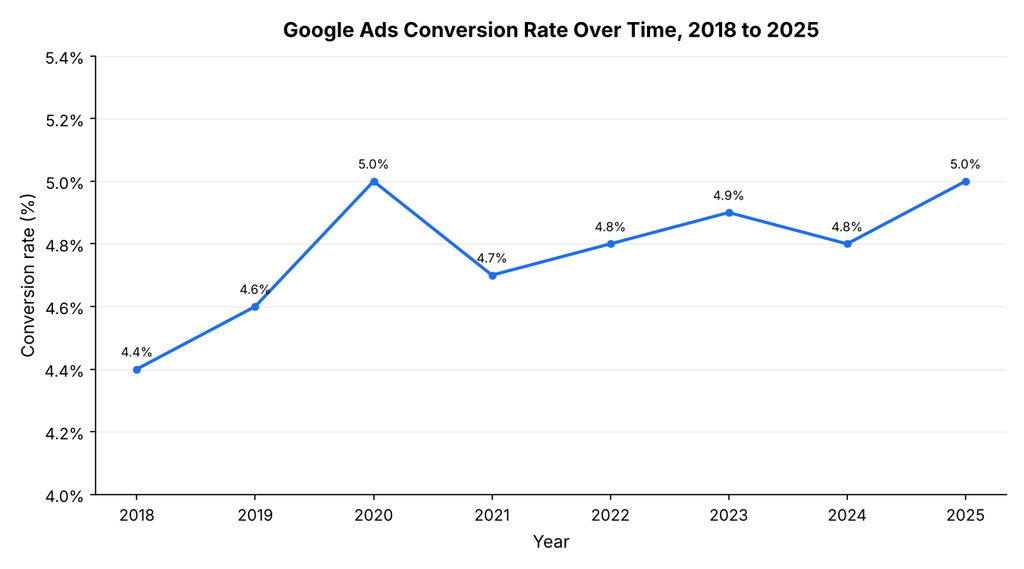
- We found that the average conversion rate rose 0.6 points over the study window, from 4.4% in 2018 to 5.0% in 2025.
- Our data showed a temporary peak of 5.0% in 2020 followed by a dip to 4.7% in 2021; we suspect shifts in demand and auction competition during that period played a role, though our dataset cannot isolate the cause.
- We observed that annual rates held between 4.7% and 5.0% from 2020 onward, which supports using the pooled 4.8% average as a stable benchmark.
Google Ads Conversion Rate by Customer Type
In the table below, we group the 139 accounts in our dataset by their primary customer base and show each group’s average conversion rate alongside its share of total ad interactions.
The Google Ads Conversion Rate by Customer Type, 2026
| Customer Type | Client Accounts | Share of Ad Interactions | Google Ads Conversion Rate |
| Primarily B2B | 87 | 33% | 3.1% |
| Primarily B2C | 28 | 42% | 6.2% |
| Mixed Customer Base | 24 | 25% | 4.7% |
| All Accounts | 139 | 100% | 4.8% |
- We found that primarily B2C accounts converted at 6.2%, twice the 3.1% rate of primarily B2B accounts.
- Our data showed that B2C accounts made up 28 of the 139 accounts but generated 42% of all ad interactions, so their higher rate carries outsized weight in the overall 4.8% average.
- We observed that accounts with a mixed customer base converted at 4.7%, close to the overall average, consistent with a blend of short consumer purchase cycles and longer business sales cycles.
Additional Reading
For more statistics on Google Search marketing, both organic (SEO) and paid (PPC), see our below reports:
- Clickthrough Rates (CTR) for Organic vs Paid Search
- Google Click-Through Rates (CTRs) by Ranking Position in 2024
- SEO vs. PPC Statistics: Conversion Rates Compared
- Digital Marketing Metrics & KPIs for 2024
- Conversion Rate by Traffic Source
- SEO ROI Statistics 2024
- Average SEO Conversion Rate By Page Type
Requesting a Copy of This Report
If you would like to request a downloadable PDF copy of this report, reach out to us here.
- First Page Sage Research Study. First Page Sage. October 2026. San Francisco, California.
- Conversion rate: Definition. Google Ads Help, Google. Accessed October 2026. Mountain View, California.
- About conversion measurement. Google Ads Help, Google. Accessed October 2026. Mountain View, California.
- Search Advertising Benchmarks for Every Industry. Stephanie Heitman, LocaliQ. June 2026. Boston, Massachusetts.
- 2025 Google Ads Benchmarks: Competitive Data & Insights for Your Industry. WordStream by LocaliQ. 2025. Boston, Massachusetts.