Last updated November 4, 2026
The following report was compiled from client data and research gathered over the last 12 years of performing organic and paid campaigns for SaaS companies, and covers average customer acquisition cost (CAC) across 28 SaaS industries.
Our CACs are blended, meaning they are the average cost of acquiring a customer from both organic and paid sources. The paid sources consist mostly of PPC campaigns and paid social, and the organic sources are primarily SEO. In the sections below, we break down CAC by industry and customer type, compare customer types overall, and identify the highest and lowest cost segments. For a view beyond SaaS, see our report on average CAC by industry.
Average CAC for SaaS Companies By Industry and Customer Type
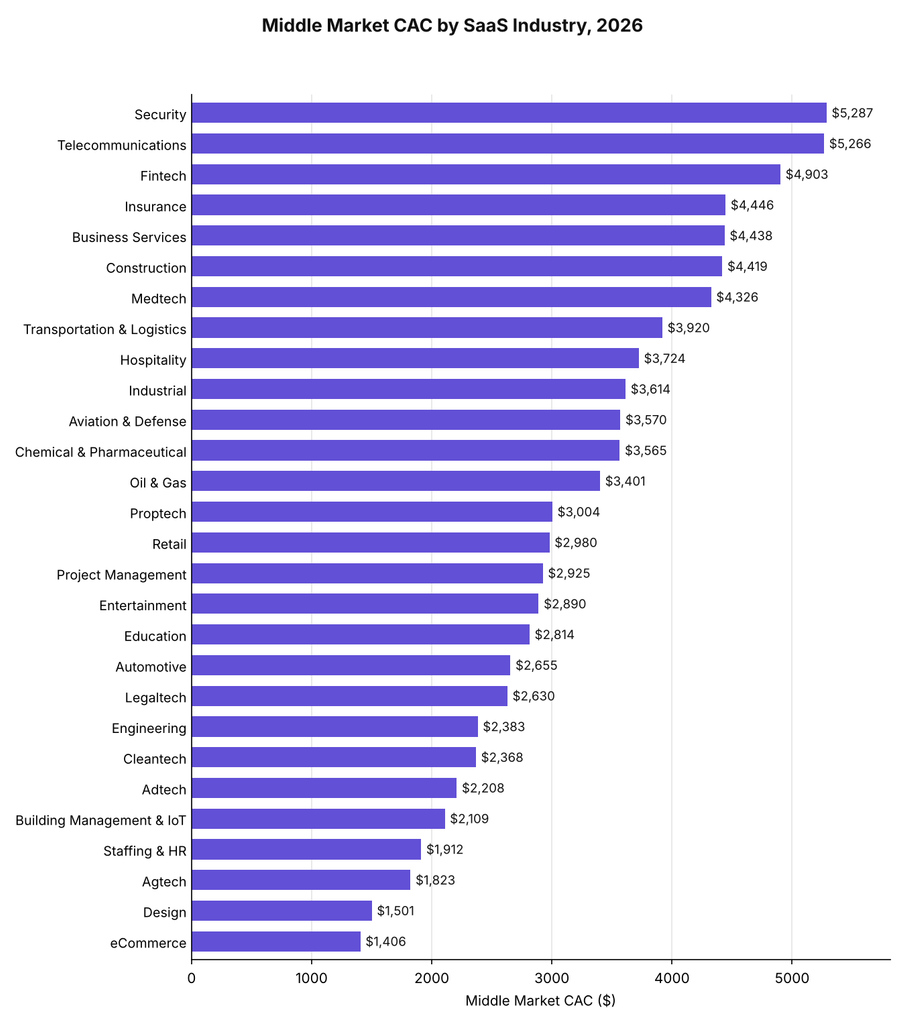
In the table below, we break down average CAC for each SaaS industry across Consumer, SMB, Middle Market, and Enterprise customers.
Average CAC for SaaS Companies By Industry and Customer Type, 2026
| SaaS Industry | Consumer | SMB | Middle Market | Enterprise |
| Adtech | N/A | $560 | $2,208 | $8,548 |
| Agtech | $243 | $612 | $1,823 | $6,948 |
| Automotive | $141 | $378 | $2,655 | $6,419 |
| Aviation & Defense | $290 | $509 | $3,570 | $7,990 |
| Building Management & IoT | $206 | $574 | $2,109 | $7,305 |
| Business Services | $228 | $585 | $4,438 | $7,247 |
| Chemical & Pharmaceutical | $275 | $816 | $3,565 | $6,018 |
| Cleantech | N/A | $674 | $2,368 | $7,321 |
| Construction | $165 | $610 | $4,419 | $7,920 |
| Design | $274 | $658 | $1,501 | $5,866 |
| eCommerce | $64 | $274 | $1,406 | $2,190 |
| Education | $264 | $806 | $2,814 | $6,659 |
| Engineering | N/A | $551 | $2,383 | $5,906 |
| Entertainment | $178 | $473 | $2,890 | $5,216 |
| Fintech | $202 | $1,450 | $4,903 | $14,773 |
| Hospitality | $355 | $907 | $3,724 | $9,448 |
| Industrial | N/A | $542 | $3,614 | $7,290 |
| Insurance | $519 | $1,280 | $4,446 | $11,228 |
| Legaltech | $161 | $299 | $2,630 | $6,441 |
| Medtech | $320 | $921 | $4,326 | $11,021 |
| Oil & Gas | $91 | $355 | $3,401 | $7,885 |
| Project Management | $227 | $891 | $2,925 | $7,430 |
| Proptech | $184 | $518 | $3,004 | $8,650 |
| Retail | $76 | $303 | $2,980 | $9,018 |
| Security | $174 | $805 | $5,287 | $10,221 |
| Staffing & HR | N/A | $410 | $1,912 | $6,754 |
| Telecommunications | $91 | $694 | $5,266 | $10,980 |
| Transportation & Logistics | $175 | $483 | $3,920 | $8,005 |
Our researchers took three main points from this data:
- We found that CAC rises from Consumer to Enterprise in every industry in the table.
- Our data showed eCommerce with the lowest CAC at every customer size.
- We found five industries without Consumer data, and we suspect those categories sell primarily to businesses.
Average CAC by Customer Type
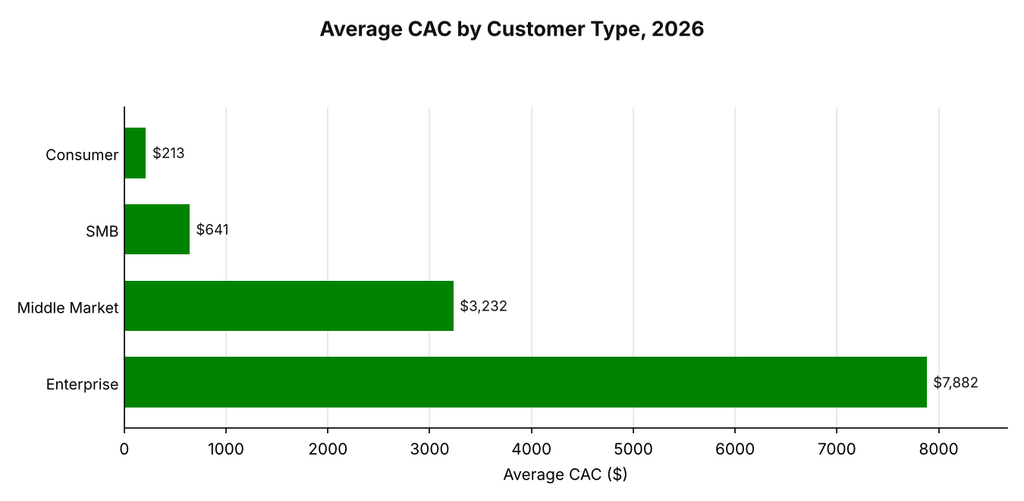
In the table below, we average each customer type across the industries in the main table, with the lowest and highest values for comparison.
Average CAC by Customer Type, 2026
| Customer Type | Average CAC | Lowest CAC | Highest CAC |
| Consumer | $213 | $64 | $519 |
| SMB | $641 | $274 | $1,450 |
| Middle Market | $3,232 | $1,406 | $5,287 |
| Enterprise | $7,882 | $2,190 | $14,773 |
Three findings stood out to our team:
- We found Enterprise CAC about 37 times Consumer CAC on average.
- Our data showed the largest proportional step between SMB and Middle Market, where average CAC rises about five times.
- We found the Enterprise range to be the widest, with a $12,583 gap between the lowest and highest industries.
Highest and Lowest CAC SaaS Segments
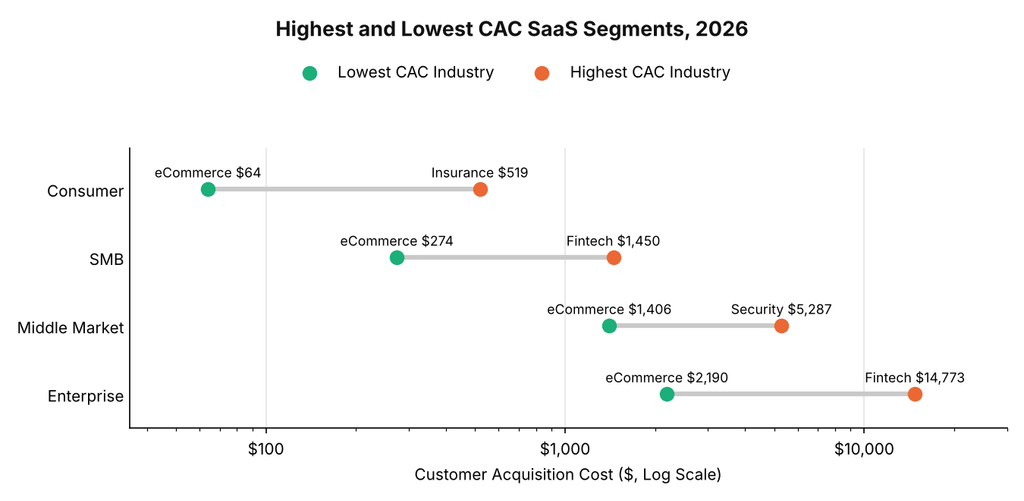
In the table below, we name the highest and lowest cost industry at each customer size.
Highest and Lowest CAC SaaS Segments, 2026
| Customer Type | Highest CAC Industry | Lowest CAC Industry |
| Consumer | Insurance ($519) | eCommerce ($64) |
| SMB | Fintech ($1,450) | eCommerce ($274) |
| Middle Market | Security ($5,287) | eCommerce ($1,406) |
| Enterprise | Fintech ($14,773) | eCommerce ($2,190) |
Our team drew three conclusions from this data:
- We found regulated categories at the top of the range, with Fintech leading at two of the four customer sizes.
- Our data showed Security taking the top spot in Middle Market at $5,287, just above Telecommunications at $5,266.
- We suspect regulated categories cost more because buyers take longer to decide, though our dataset cannot isolate the cause.
A lead generation firm or B2B SEO partner can often bring costs below these averages. For more on this topic, see our reports on CAC by channel, the SaaS LTV to CAC ratio, average customer lifetime value, and SEO strategy for SaaS.
Requesting a Copy of This Report
If you’d like to request a PDF copy of this report or learn more about our agency, you can reach out here.
- First Page Sage Research Study. First Page Sage. November 2026. San Francisco, California.
- Gross Revenue Retention (GRR) Benchmarks. Aleph and Benchmarkit. November 2026.
- The 2026 SaaS Benchmarks Report. Ryan Allis, SaasRise. June 2026.
- B2B SaaS CAC and Payback Benchmarks. Digital Astronauts. 2026.