Last updated: May 5, 2026
In this report, we share average landing page conversion rate data gathered from B2B companies we worked with between 2019 and 2026, segmented by landing page type and by industry. We included 83 companies across 27 industries in our analysis. All clients in our study engaged us for an SEO campaign, and 38 companies also made use of our supporting content creation, email marketing, or LinkedIn marketing services.
For the purpose of this report, we define a conversion as a contact form fill, demo signup, gated white paper download, newsletter subscription, purchase, or other action that fulfills the call-to-action found on its respective landing page. A page’s conversion rate, then, is the percent of page visitors who undertake one or several of these actions over a given period of time (for reference, measurements are typically taken by quarter).
Our analysis included 6 types of landing pages: Product Pages, Service Pages, Industry Pages, Location Pages, Customer Type Pages, and Application Pages. We do not include Home Pages, About Pages, or other more general informational pages.
The results of our study are found below:
B2B Landing Page Conversion Rates by Page Type
| Landing Page Type | Example Page | Conversion Rate | Notes |
| Customer Type |  | 3.5% | Customer-type pages are explicitly targeted to well-defined client profiles. Consequently, when this client lands on this page the conversion rate is high, with respect to other landing pages. |
| Application | 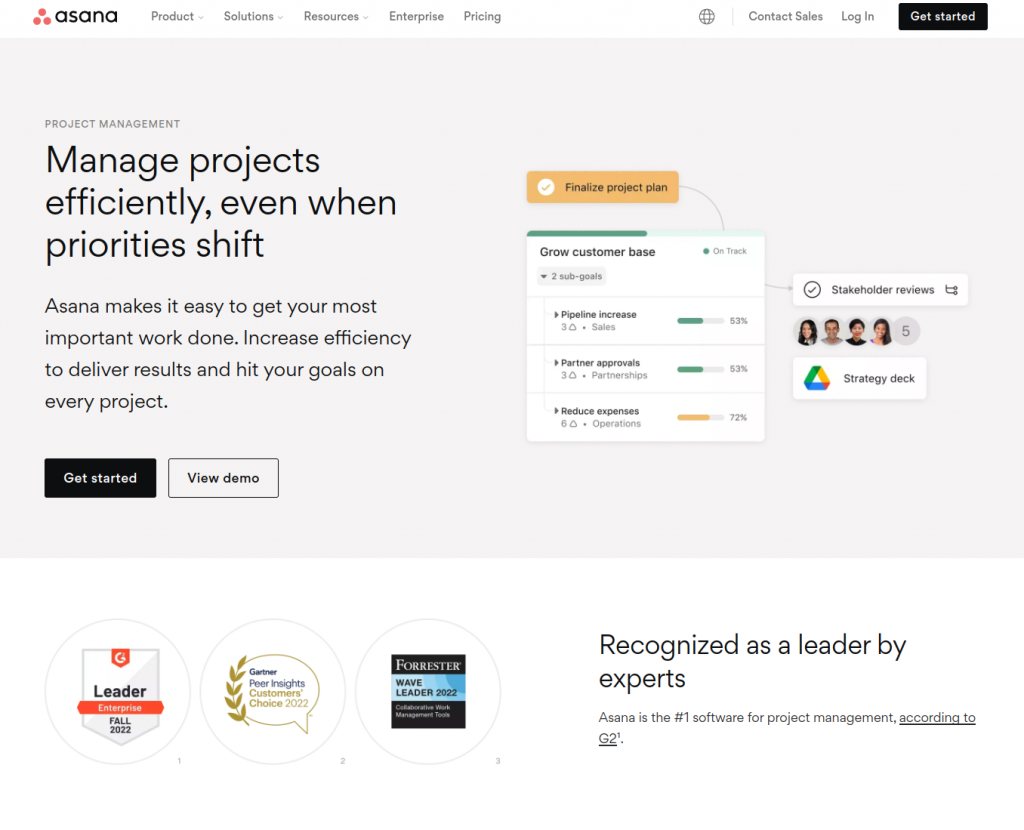 | 3.1% | Similar to service pages, application pages should demonstrate your experience in a solving a problem that is similar to the reader’s issue. |
| Product | 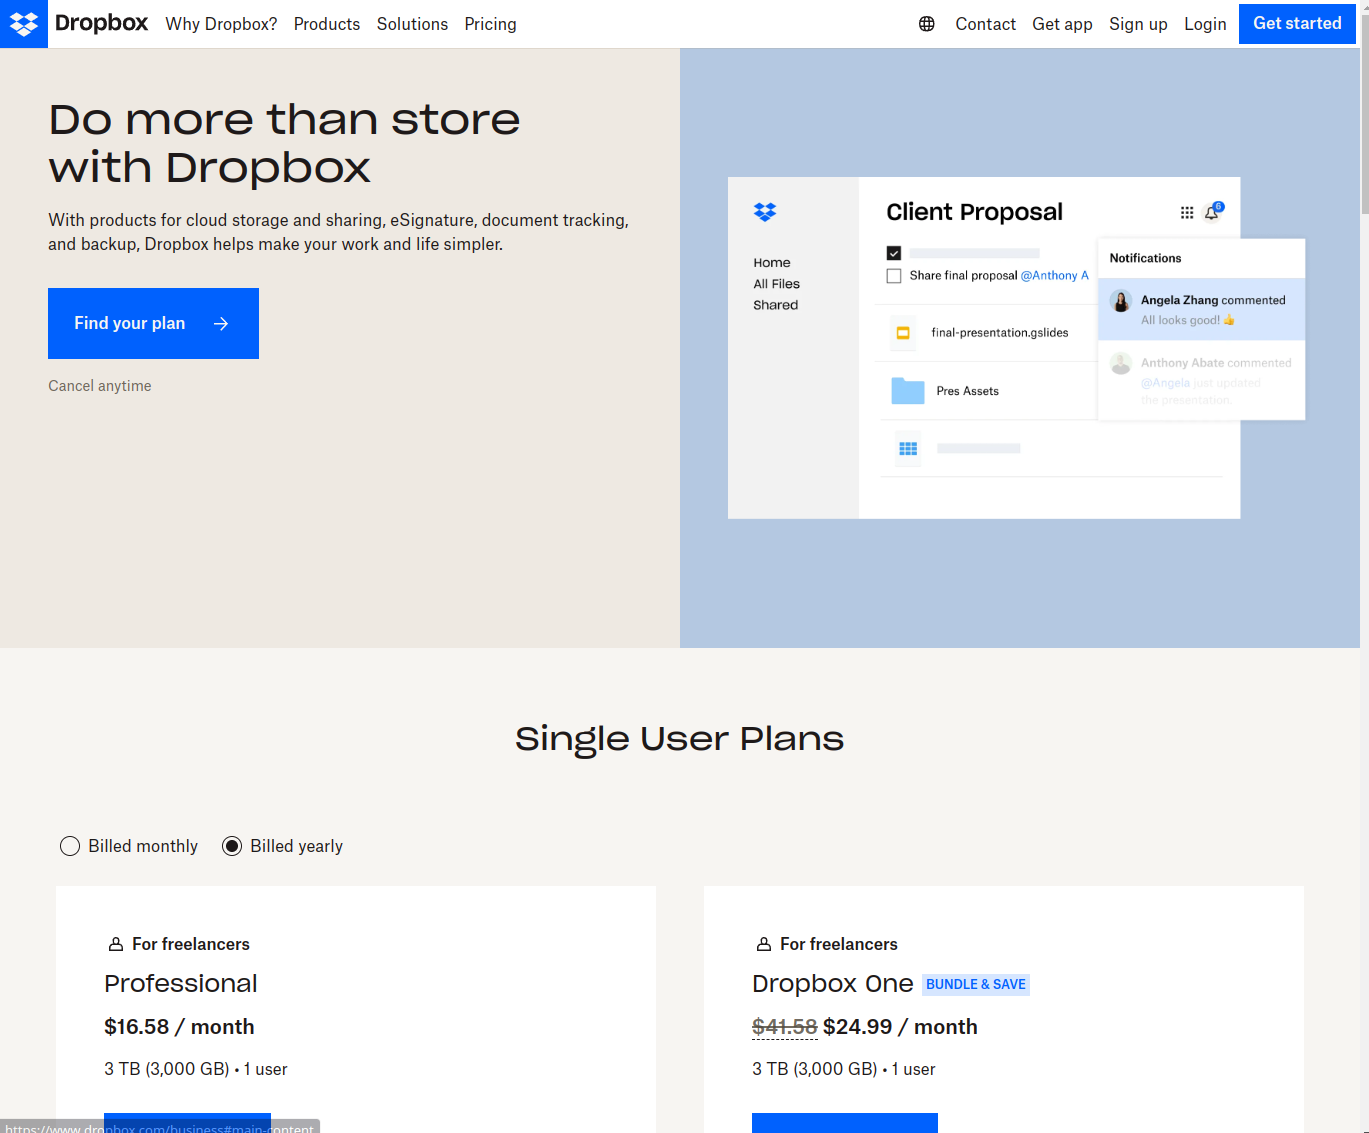 | 2.9% | Product pages are typically direct and enjoy relatively high conversion rates as they are used to target the most transactional search intents. |
| Service | 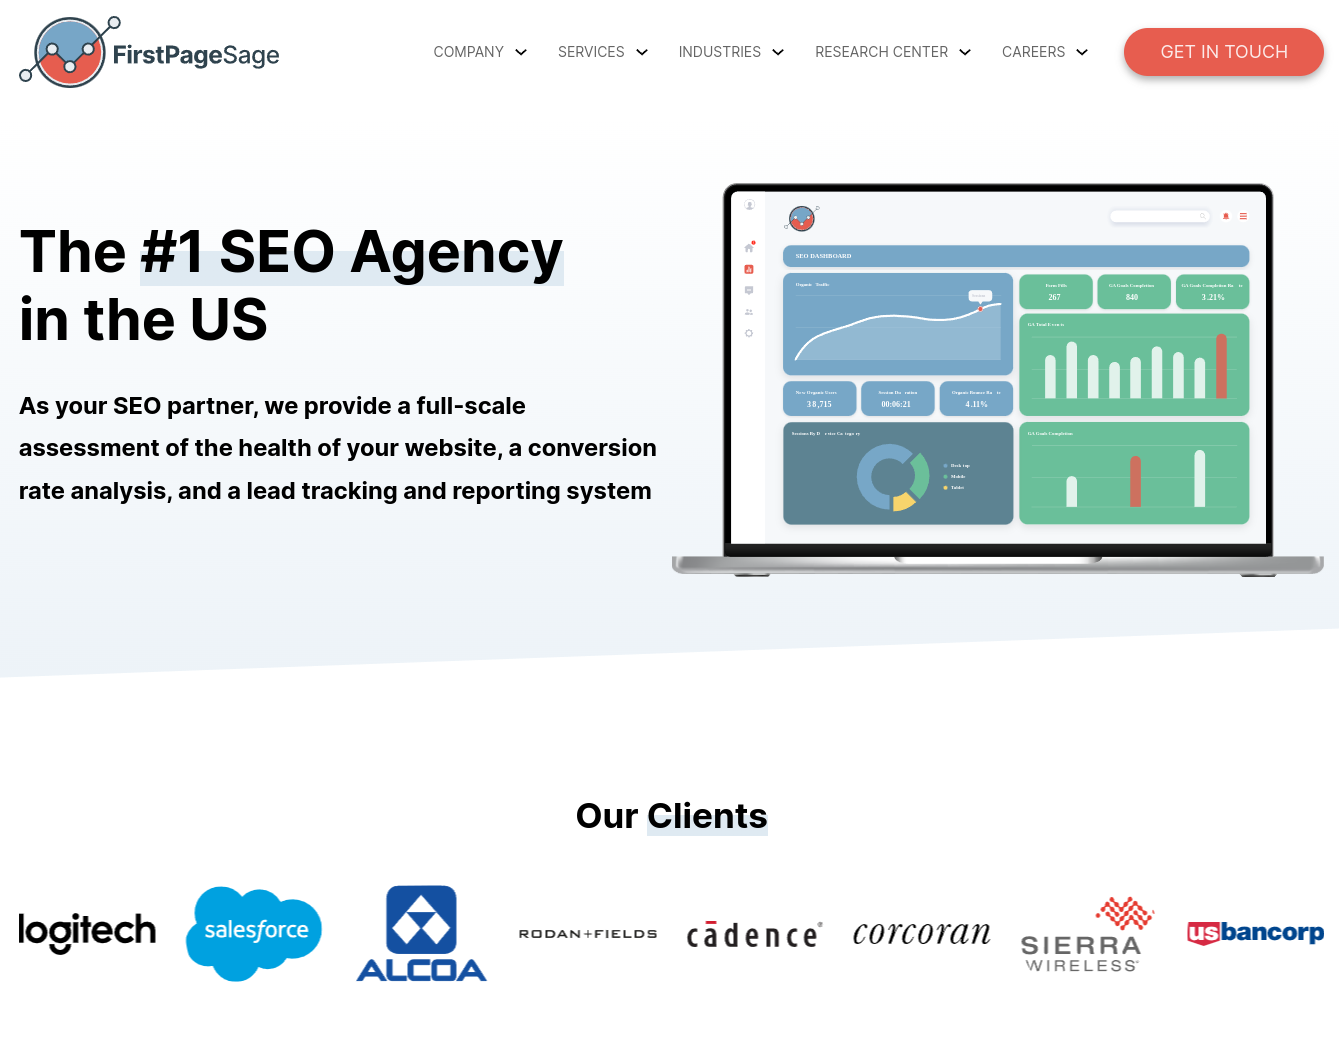 | 2.7% | Service pages are similar to product pages, in that they enjoy relatively high conversion rates because of the customer journey stage that visitors are in when they reach a service page. |
| Industry | 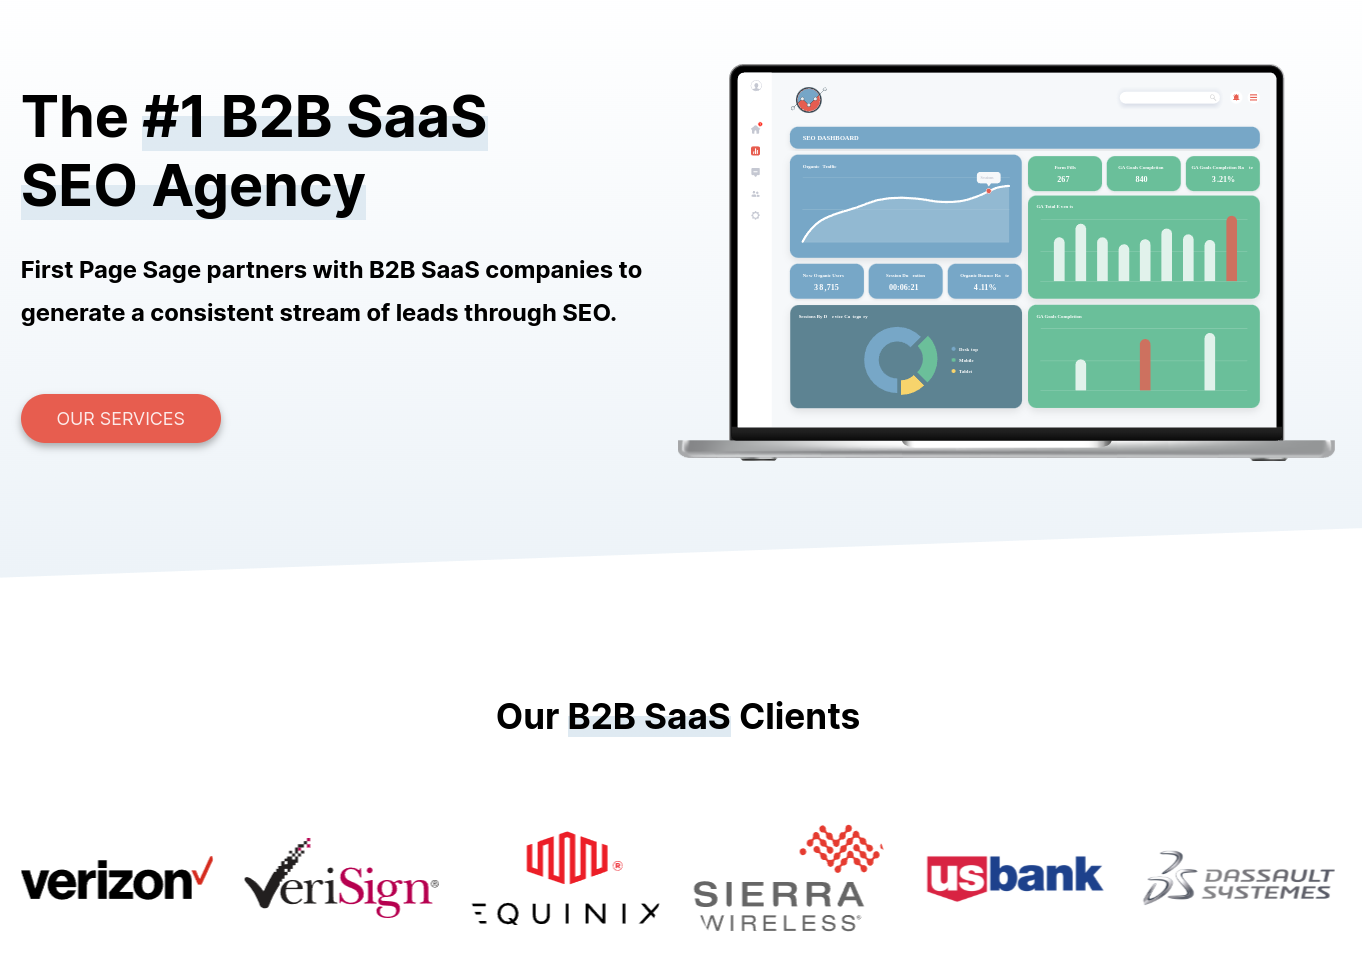 | 1.8% | These pages serve dual purpose. First, that you understand the industry and second that you have demonstrated expertise in the industry. |
| Location |  | 1.1% | Location landing pages should make it clear to visitors that you are familiar with nuances of the specific geographic area that must be considered to successfully deliver the service/product being provided. Many location pages suffer from poor conversion rates because of duplicate content. |
B2B Landing Page Conversion Rates by Industry
| Industry | Conversion Rate |
| Aerospace & Defense | 1.8% |
| Automotive | 1.2% |
| Aviation | 1.0% |
| B2B SaaS | 1.1% |
| Biotech | 1.0% |
| Business Consulting | 1.7% |
| Commercial Insurance | 1.6% |
| Construction | 1.9% |
| Cybersecurity | 1.4% |
| eCommerce | 1.6% |
| Education | 2.7% |
| Engineering | 1.2% |
| Entertainment | 1.1% |
| Environmental Services | 1.3% |
| Financial Services | 1.8% |
| HVAC Services | 3.1% |
| IT & Managed Services | 1.5% |
| Legal Services | 3.4% |
| Manufacturing | 2.2% |
| Medical Device | 1.6% |
| Oil & Gas | 2.6% |
| PCB Design & Manufacturing | 1.1% |
| Pharmaceutical | 1.9% |
| Real Estate | 2.8% |
| Software Development | 1.2% |
| Solar Energy | 1.8% |
| Transportation & Logistics | 1.4% |
How to Improve B2B Landing Page Conversion Rates
The following landing page strategies delivered the most consistent improvements across clients.
- Reduce Form Fields: For early-stage conversions, limit fields to email, first name, and company (optional). For demo requests, add additional fields like job title or phone number.
- Add Trust Signals: If not present already, ensure that the landing page includes client logos, review scores, testimonials, and certification information.
- Include Product Features & Highlights: Demonstrate value to the reader by including clear product information that directly addresses their pain points in a visually interesting way.
- Include Mid-Page Calls to Action: Assume the reader is likely not going to make it all the way down the page and include options for them to move deeper into the sales funnel with offers for a free demo or to be added to the mailing list.
Further Reading and Requesting a Copy of this Report
To learn more about conversion rates, see our other resources below:
- Sales Funnel Conversion Rate Benchmarks: 2025 Report
- Lead-to-MQL Conversion Rate Benchmarks by Industry & Channel
- SQL to Closed Won Conversion Rate (Close Rate) by Industry: 2025 Report
- Landing Page Conversion Rates by Industry: 2025 Report
- B2B Conversion Rates By Industry
- SEO Conversion Statistics Compendium
- SEO vs. PPC Statistics: Conversion Rates Compared
- Average SEO Conversion Rate by Page Type
For a PDF copy of this report, or if you would like to know more about ways to maximize your conversion rate, contact our agency here.