Last updated October 8, 2026
The 2026 edition of our Cost Per Lead by Industry report was compiled by our marketing research team from lead generation data collected between January 2022 and August 2026. Across the 30 industries in our dataset, the average blended cost per lead rose 2.2% from the prior edition to $400, with paid and organic costs moving in opposite directions.
Cost Per Lead (CPL) is the gross marketing cost required to acquire one lead for your business. We calculate it by dividing total marketing spend by the total number of new leads acquired from a specific channel or group of channels, as shown in the equation below:

A lead is a direct connection with a prospective customer who is interested in purchasing a product or service, made by email, phone, or in-person introduction. The cost of a lead is incurred regardless of how that conversation ends, which distinguishes CPL from customer acquisition cost, a metric that measures the price of acquiring closed customers and includes the cost of sales.
CPL should always be read alongside lead quality, because quality varies widely by acquisition cost. Referral channels tend to deliver warm leads who are well-primed to buy from the right company, while cold leads purchased from outbound vendors convert at a far lower rate. We recommend tracking and measuring each paid and organic lead generation channel in which you invest, then narrowing your investments to the ones that produce customers with the highest lifetime value, rate of referral, and overall satisfaction relative to their acquisition cost.
Two movements define this year’s dataset. Paid CPL declined in 15 of the 30 industries we track as conversion rates on search campaigns improved, while organic CPL rose in all 30 as AI-generated answers in search results reduced the share of searches that end in a click. In the sections below, we break down average CPL by industry for paid and organic channels, the change from our 2025 report, and the averages by sector.
Average Cost Per Lead by Industry
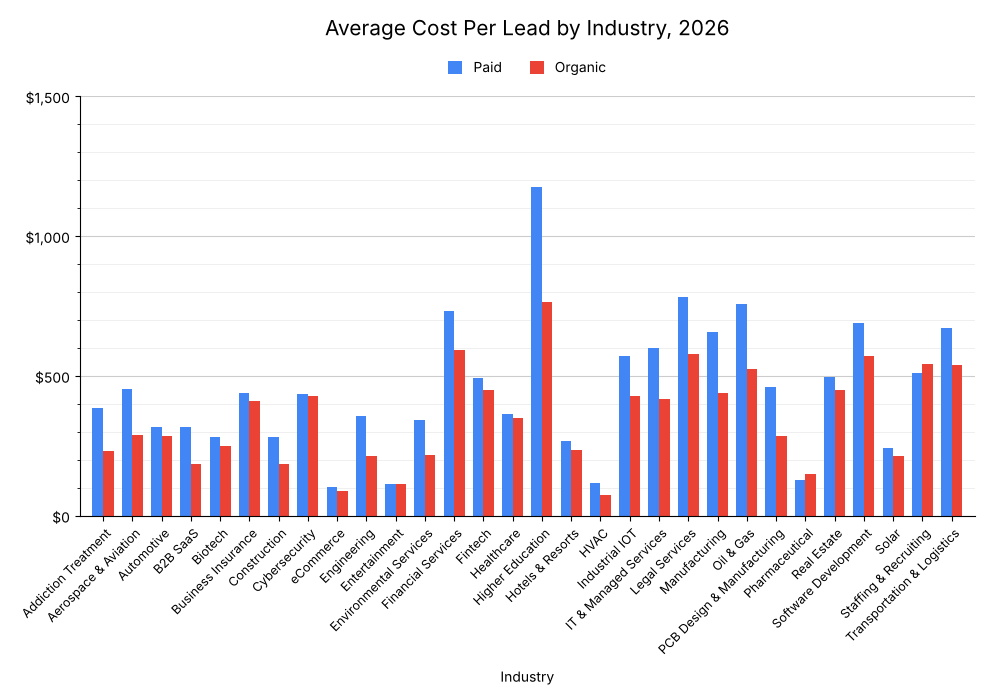
In the table below, we break down the average paid, organic, and blended CPL for each of the 30 industries in our dataset. Blended CPL is weighted by the share of leads each channel type produced in that industry.
The Average Cost Per Lead by Industry, 2026
| Industry | Average Paid CPL | Average Organic CPL | Average CPL (Blended) |
| Addiction Treatment | $384 | $232 | $304 |
| Aerospace & Aviation | $453 | $290 | $375 |
| Automotive | $319 | $285 | $302 |
| B2B SaaS | $318 | $186 | $249 |
| Biotech | $281 | $249 | $265 |
| Business Insurance | $440 | $412 | $427 |
| Construction | $282 | $185 | $235 |
| Cybersecurity | $434 | $427 | $429 |
| eCommerce | $102 | $90 | $96 |
| Engineering | $355 | $214 | $284 |
| Entertainment | $115 | $114 | $115 |
| Environmental Services | $343 | $217 | $283 |
| Financial Services | $731 | $591 | $662 |
| Fintech | $494 | $451 | $473 |
| Healthcare | $363 | $348 | $356 |
| Higher Education | $1,176 | $766 | $970 |
| Hotels & Resorts | $268 | $234 | $250 |
| HVAC | $118 | $73 | $96 |
| Industrial IOT | $573 | $427 | $501 |
| IT & Managed Services | $600 | $418 | $505 |
| Legal Services | $783 | $580 | $682 |
| Manufacturing | $657 | $440 | $547 |
| Oil & Gas | $756 | $526 | $639 |
| PCB Design & Manufacturing | $462 | $284 | $371 |
| Pharmaceutical | $126 | $148 | $140 |
| Real Estate | $496 | $450 | $472 |
| Software Development | $691 | $573 | $627 |
| Solar | $243 | $213 | $227 |
| Staffing & Recruiting | $511 | $543 | $526 |
| Transportation & Logistics | $671 | $538 | $604 |
- We found that Higher Education remains the most expensive industry for lead generation at a blended CPL of $970, followed by Legal Services at $682 and Financial Services at $662. eCommerce and HVAC share the lowest blended CPL at $96.
- Our data showed that paid leads cost more than organic leads in 28 of 30 industries, and that the average paid CPL across all industries is 29% higher than the average organic CPL. Pharmaceutical and Staffing & Recruiting are the two exceptions.
- We found that the gap between paid and organic CPL is widest in B2B SaaS, where a paid lead costs 71% more than an organic one, followed by Engineering and Addiction Treatment at 66% each.
Change in Average Cost Per Lead by Industry, 2025 to 2026
In the table below, we compare this year’s figures with those published in our 2025 report, showing the percentage change in paid, organic, and blended CPL for each industry.
The Change in Average Cost Per Lead by Industry, 2025 to 2026
| Industry | 2025 Blended CPL | 2026 Blended CPL | Change in Paid CPL | Change in Organic CPL | Change in Blended CPL |
| Addiction Treatment | $297 | $304 | +1.1% | +8.9% | +2.4% |
| Aerospace & Aviation | $373 | $375 | -3.4% | +4.7% | +0.5% |
| Automotive | $283 | $302 | +8.1% | +5.2% | +6.7% |
| B2B SaaS | $237 | $249 | +2.6% | +13.4% | +5.1% |
| Biotech | $255 | $265 | +2.6% | +5.5% | +3.9% |
| Business Insurance | $424 | $427 | -4.3% | +6.2% | +0.7% |
| Construction | $227 | $235 | +0.7% | +6.3% | +3.5% |
| Cybersecurity | $406 | $429 | +5.6% | +5.7% | +5.7% |
| eCommerce | $91 | $96 | +4.1% | +8.4% | +5.5% |
| Engineering | $287 | $284 | -4.3% | +6.5% | -1.0% |
| Entertainment | $114 | $115 | -0.9% | +2.7% | +0.9% |
| Environmental Services | $278 | $283 | -0.9% | +4.8% | +1.8% |
| Financial Services | $653 | $662 | -3.9% | +6.5% | +1.4% |
| Fintech | $452 | $473 | +0.8% | +9.2% | +4.6% |
| Healthcare | $361 | $356 | -9.5% | +8.7% | -1.4% |
| Higher Education | $982 | $970 | -6.7% | +8.7% | -1.2% |
| Hotels & Resorts | $266 | $250 | -13.0% | +4.5% | -6.0% |
| HVAC | $92 | $96 | +2.6% | +5.8% | +4.3% |
| Industrial IOT | $497 | $501 | -2.9% | +5.7% | +0.8% |
| IT & Managed Services | $503 | $505 | -2.8% | +8.6% | +0.4% |
| Legal Services | $649 | $682 | -0.1% | +12.4% | +5.1% |
| Manufacturing | $553 | $547 | -4.9% | +6.0% | -1.1% |
| Oil & Gas | $637 | $639 | -2.1% | +4.8% | +0.3% |
| PCB Design & Manufacturing | $376 | $371 | -3.7% | +4.8% | -1.3% |
| Pharmaceutical | $131 | $140 | +1.6% | +9.6% | +6.9% |
| Real Estate | $448 | $472 | +3.3% | +8.2% | +5.4% |
| Software Development | $591 | $627 | +1.6% | +12.4% | +6.1% |
| Solar | $206 | $227 | +12.0% | +8.7% | +10.2% |
| Staffing & Recruiting | $497 | $526 | +7.4% | +4.8% | +5.8% |
| Transportation & Logistics | $588 | $604 | +0.1% | +6.5% | +2.7% |
Paid and organic costs diverged in this edition. The average paid CPL across the 30 industries fell 1.3%, from $458 to $452, with decreases in 15 industries led by Hotels & Resorts, Healthcare, and Higher Education. This movement is consistent with public search advertising benchmarks from WordStream, which recorded the first annual decrease in cost per lead in five years as conversion rates improved across most business categories. The average organic CPL rose 7.3%, from $326 to $350, and increased in every industry. We attribute most of that increase to AI-generated summaries in search results. Studies by Pew Research Center and Ahrefs each measured substantially lower click-through rates on results pages that include an AI summary, which means the same content investment now yields fewer visits and fewer leads. The increases were largest in B2B SaaS, Legal Services, and Software Development, three industries whose buyers begin with informational research queries. The net effect was a rise in blended CPL in 24 of 30 industries and a narrowing of the paid premium over organic from 40% to 29%.
Average Cost Per Lead by Sector
In the table below, we aggregate the 30 industries into six sectors and report the average paid, organic, and blended CPL for each. Sector figures are unweighted averages of the industries they include.
The Average Cost Per Lead by Sector, 2026
| Sector | Industries Included | Average Paid CPL | Average Organic CPL | Average CPL (Blended) |
| Education | Higher Education | $1,176 | $766 | $970 |
| Financial & Professional Services | Business Insurance, Financial Services, Legal Services, Real Estate, Staffing & Recruiting | $592 | $515 | $554 |
| Technology | B2B SaaS, Cybersecurity, Fintech, Industrial IOT, IT & Managed Services, Software Development | $518 | $414 | $464 |
| Industrial & Energy | Aerospace & Aviation, Construction, Engineering, Environmental Services, Manufacturing, Oil & Gas, PCB Design & Manufacturing, Solar, Transportation & Logistics | $469 | $323 | $396 |
| Healthcare & Life Sciences | Addiction Treatment, Biotech, Healthcare, Pharmaceutical | $288 | $244 | $266 |
| Consumer & Local Services | Automotive, eCommerce, Entertainment, Hotels & Resorts, HVAC | $184 | $159 | $172 |
- We found that CPL rises with contract value and sales cycle length. Leads in Financial & Professional Services (554)andTechnology(464) cost roughly three times as much as leads in Consumer & Local Services ($172).
- Our data showed that the paid premium is widest in Industrial & Energy, where the average paid lead costs 45% more than the average organic lead, and narrowest in Financial & Professional Services at 15%.
- We found that Financial & Professional Services and Technology recorded the largest increases in blended CPL from our 2025 report, at 3.7% and 3.6%. Education was the only sector in which blended CPL declined.
Selecting The Right Lead Generation Channels To Invest In
Each lead generation channel carries its own balance of cost, speed, and lead quality. As a general rule, organic channels produce a higher long-term ROI than paid channels but require a longer lead time before they deliver results. That advantage comes from their scalability and from the fact that leads generated through organic channels tend to be lower-funnel than those generated through paid ones. This year’s data adds one qualification: organic leads became more expensive in every industry we measured, yet they remain less expensive than paid leads in 28 of 30.
For most companies, the most effective lead generation strategy is still to use organic channels such as SEO and industry speaking engagements as the primary driver of new leads, and to add paid channels such as PPC and trade shows when short-term growth is needed. We recommend responding to the rise in organic CPL by raising content quality, since original research and thought leadership are the content types most likely to be cited in AI-generated answers. Companies that find in-house lead generation difficult to set up often outsource it to a dedicated agency while they build their internal team.
Requesting a Copy of This Report
If you would like to request a PDF copy of this report or learn more about our agency, you can reach out here.
- First Page Sage Research Study. October 2026. San Francisco, California.
- Marino, Susie. “Google Ads Benchmarks 2026: Competitive Data & Insights for Every Industry.” WordStream. May 2026. Boston, Massachusetts.
- Marino, Susie. “Facebook Ads Benchmarks 2026: NEW Data, Trends, & Insights for Your Industry.” WordStream. September 2026. Boston, Massachusetts.
- Chapekis, Athena, and Anna Lieb. “Google users are less likely to click on links when an AI summary appears in the results.” Pew Research Center. July 2025. Washington, D.C.
- Law, Ryan. “AI Overviews Reduce Clicks by 34.5%.” Ahrefs. April 2025. Singapore.
- Gartner. “Gartner 2026 CMO Spend Survey Finds CMOs Allocate 15.3% of Marketing Budgets to AI, But Only 30% Are Ready to Scale AI Capabilities.” May 2026. London, United Kingdom.