Last updated November 4, 2026
The following report was compiled from anonymized client data and research from January 2022 through October 2026, covering average customer acquisition cost (CAC) in 27 B2B industries and 22 SaaS industries.
CAC is total marketing and sales spend divided by the number of new customers acquired. It should be calculated on an annual or rolling annual basis to account for seasonal fluctuations, and it can also be calculated by channel to compare disparate marketing channels against each other. Alongside customer lifetime value (LTV), it is the starting point for evaluating marketing ROI, because it shows which channels deserve more investment and how a marketing department compares with industry benchmarks.

This report focuses on B2B CACs. For consumer benchmarks, see our report on Average Customer Acquisition Cost (CAC) by Industry: B2C Edition. In the sections below, we break down CAC by industry, by SaaS segment, and in relation to customer lifetime value.
Average Customer Acquisition Cost (CAC) By Industry
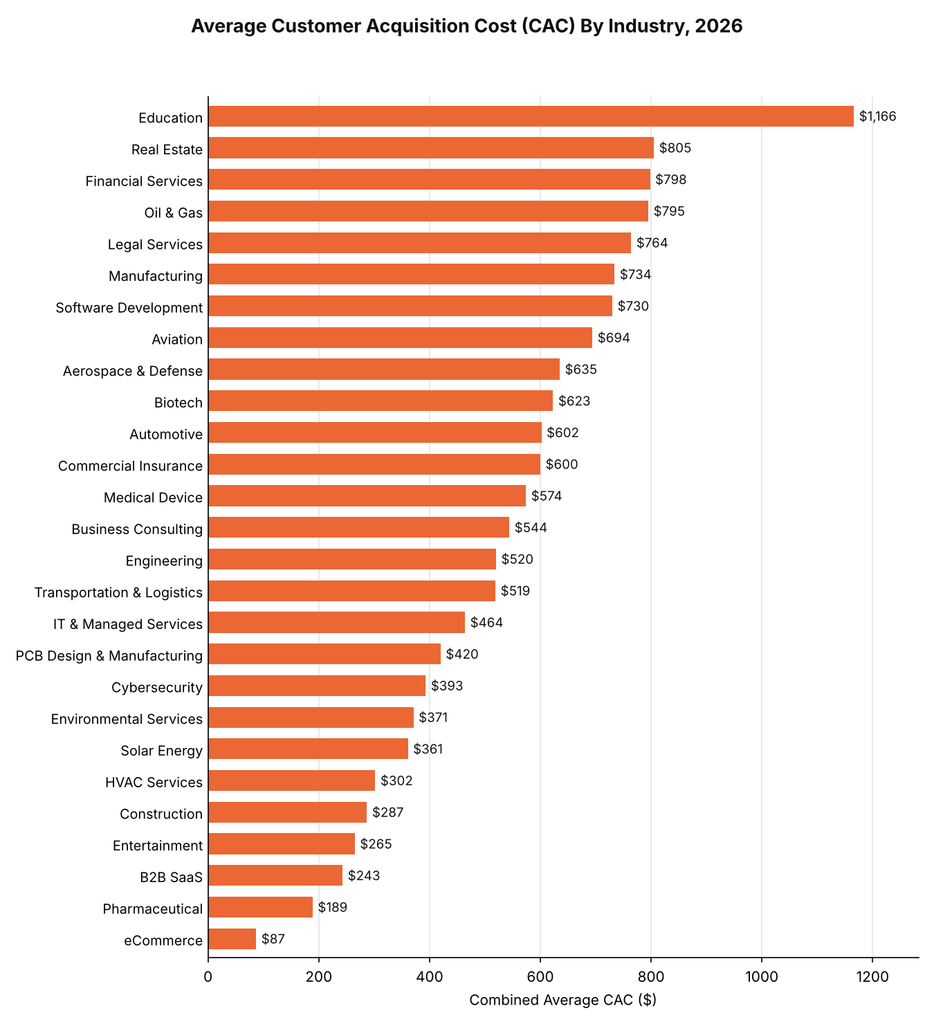
In the table below, we break down organic, inorganic, and combined CAC for each of the 27 industries. Three limitations apply to our dataset:
- Organic CACs consist primarily of SEO and Organic Social. Inorganic CACs comprise primarily PPC / SEM and Paid Social.
- The analysis excludes email marketing, in-person events, direct mail, outdoor advertising, and other forms of lead generation due to insufficient data.
- Our Organic CAC data is weighted toward SEO because we are an SEO company, and our Inorganic CAC data is weighted toward PPC / SEM because our clients are primarily B2B. The Combined Average CAC is weighted 75% organic and 25% inorganic, reflecting our firm’s marketing services.
Average Customer Acquisition Cost (CAC) By Industry, 2026
| Industry | Organic CAC | Inorganic CAC | Combined Average CAC |
| Aerospace & Defense | $526 | $961 | $635 |
| Automotive | $491 | $935 | $602 |
| Aviation | $588 | $1,012 | $694 |
| B2B SaaS | $205 | $357 | $243 |
| Biotech | $532 | $895 | $623 |
| Business Consulting | $410 | $943 | $544 |
| Commercial Insurance | $590 | $628 | $600 |
| Construction | $212 | $509 | $287 |
| Cybersecurity | $345 | $536 | $393 |
| eCommerce | $87 | $85 | $87 |
| Education | $862 | $2,078 | $1,166 |
| Engineering | $459 | $703 | $520 |
| Entertainment | $190 | $490 | $265 |
| Environmental Services | $229 | $797 | $371 |
| Financial Services | $644 | $1,258 | $798 |
| HVAC Services | $211 | $575 | $302 |
| IT & Managed Services | $325 | $879 | $464 |
| Legal Services | $584 | $1,303 | $764 |
| Manufacturing | $662 | $947 | $734 |
| Medical Device | $501 | $790 | $574 |
| Oil & Gas | $710 | $1,050 | $795 |
| PCB Design & Manufacturing | $330 | $689 | $420 |
| Pharmaceutical | $196 | $167 | $189 |
| Real Estate | $660 | $1,240 | $805 |
| Software Development | $680 | $880 | $730 |
| Solar Energy | $235 | $740 | $361 |
| Transportation & Logistics | $436 | $766 | $519 |
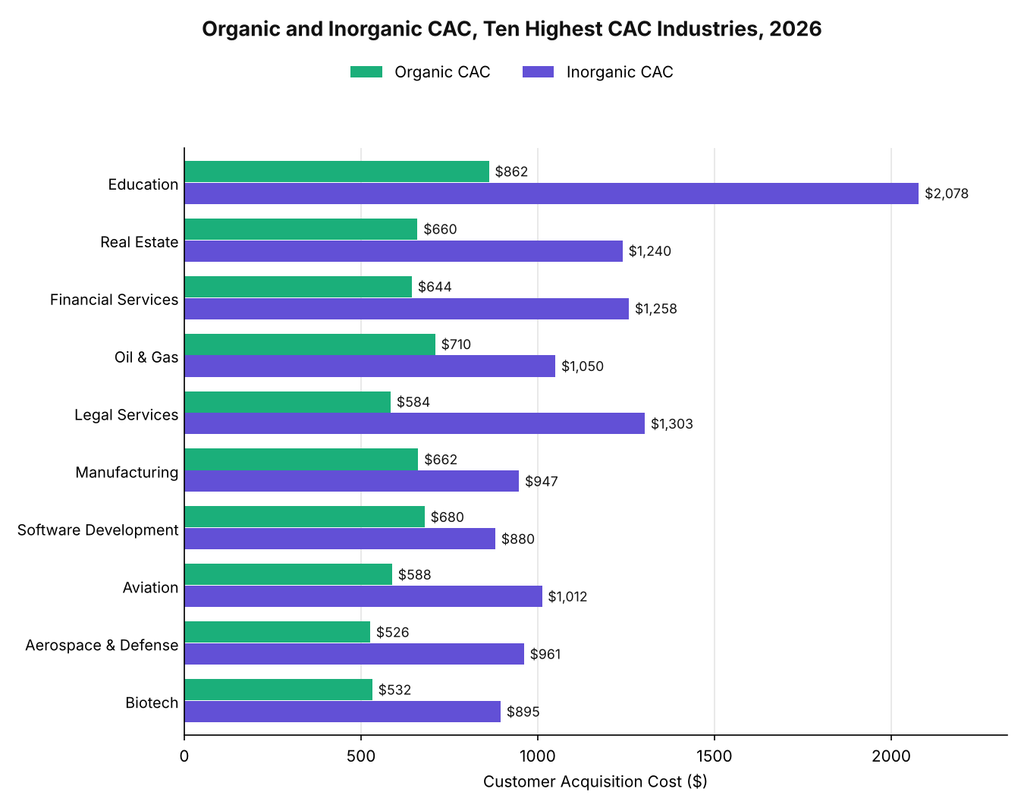
Our researchers took three main points from this data:
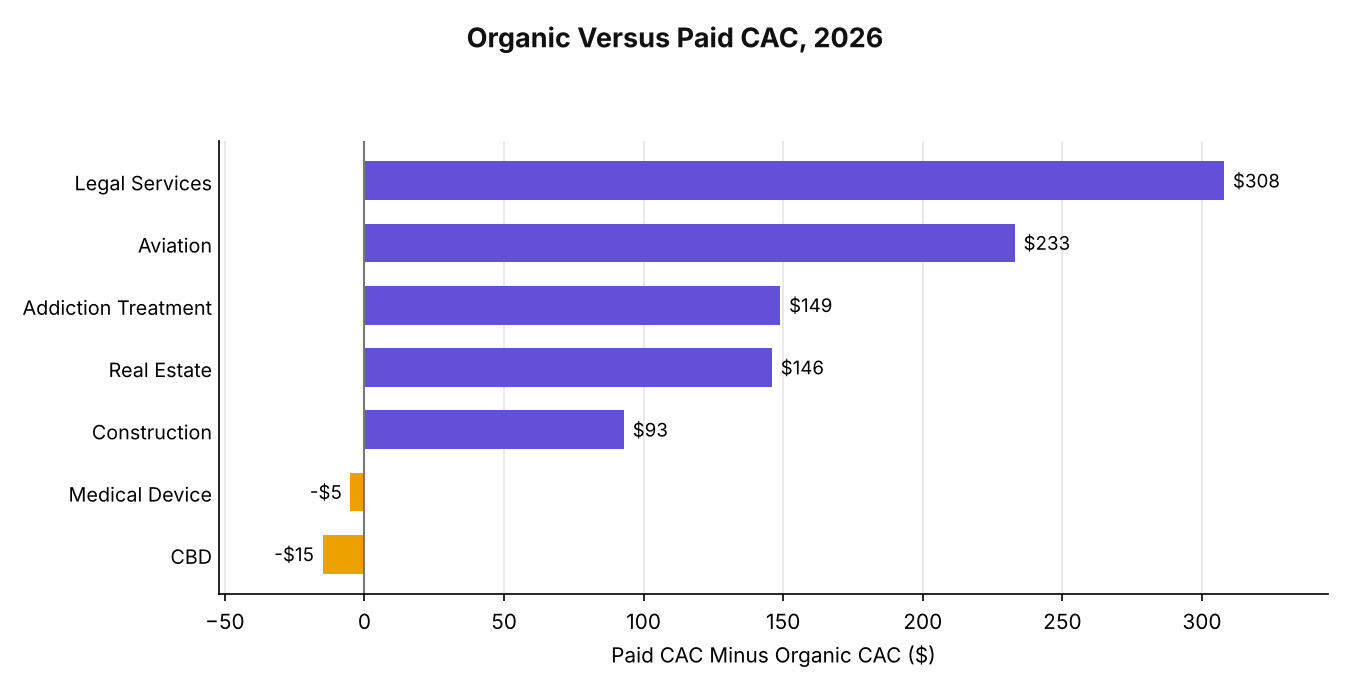
- We found that Organic CAC came in below Inorganic CAC in 25 of 27 industries, with eCommerce and Pharmaceutical as the two exceptions.
- Our data showed the widest spreads in Environmental Services and Solar Energy, where Inorganic CAC runs more than three times Organic CAC.
- We found combined CAC ranging from $87 in eCommerce to $1,166 in Education, the highest in the dataset.
In the table below, we share what our team has observed about the lowest-CAC channels in each industry.
Channel Notes by Industry, 2026
| Industry | Notes |
| Aerospace & Defense | Aerospace is an industry with relatively few major players, making ABM significantly more effective than in other industries. |
| Automotive | Automotive industry CACs tend to be lowest from long term campaigns of any kind, with SEO and email campaigns performing best for e-commerce sites and brand advertising performing well for auto part and dealership businesses. |
| Aviation | Paid and organic Google marketing, as well as social marketing, produce the best CACs for flight training schools and charter businesses. |
| B2B SaaS | Offering free trials or using a freemium model leads to higher B2B SaaS conversions, driving down CACs when compared to most other B2B industries. GEO has also been particularly effective for attracting SaaS customers. |
| Biotech | Conferences and exhibitions, LinkedIn advertising, and SEO tend to have the lowest CACs in biotech. |
| Business Consulting | Strategic SEO and GEO campaigns yield the lowest CACs in the business consulting space, as search engines are intent-based and businesses have a large variety of specific issues for which executives query Google. |
| Commercial Insurance | CACs are highest for D&O and Key Person insurance and lowest for employee benefits consulting. |
| Construction | Larger construction companies tend to acquire customers at the best cost through biz dev partnerships, while smaller construction companies such as ADU builders or luxury home builders find favorable CACs from SEO and paid social. |
| Cybersecurity | The lowest CACs in cybersecurity tend to come from PR, paid list placements, and SEO. GEO is an emerging category delivering low CACs as well. |
| eCommerce | While less dominant than in the B2C market, Amazon still accounts for the lion’s share of B2B ecommerce purchases. Combining Amazon SEO with traditional Google Search focused SEO effectively lowers CACs. |
| Education | The education sector benefits heavily from thought leadership-focused marketing due to its prestige-oriented nature. |
| Engineering | Engineering companies see strong returns from investing in modular content strategies and creating content that can be used across multiple customer acquisition channels. |
| Entertainment | Entertainment companies tend to invest most of their marketing spend in inorganic customer acquisition channels such as advertising. |
| Environmental Services | SEO and organic social tend to deliver the best CACs for civil engineering firms and energy efficiency consultancies. |
| Financial Services | Competitive CACs in financial services tend to come from partnerships with larger financial institutions and thought leadership marketing campaigns that involve forecasts, trend reports, and white papers. |
| HVAC Services | HVAC companies receive the lowest CACs from SEO and, in some cases, local advertising. |
| IT & Managed Services | MSPs and IT services companies see their lowest CACs from white label partnerships, LinkedIn, and SEO. |
| Legal Services | The highly competitive nature of the legal services industry drives up CACs, even when using lower-CAC channels such as SEO and organic LinkedIn. |
| Manufacturing | SEO is highly effective for lowering manufacturing CACs. |
| Medical Device | B2B medical device CACs are driven by hospital purchasing needs, and in-person lead generation such as trade shows and networking plays a large role. |
| Oil & Gas | Oil and gas companies tend to favor more traditional forms of customer acquisition, particularly in-person channels such as trade shows and industry networking. |
| PCB Design & Manufacturing | PCB design and manufacturing is a heavily competitive industry, but content-based customer acquisition channels tend to perform particularly well. |
| Pharmaceutical | While traditionally focused on TV advertising, customer acquisition in the pharmaceuticals industry has been increasingly driven by digital marketing. |
| Real Estate | While real estate CACs are notably high, both consumer and business customers produce significant lifetime value. |
| Software Development | Organic social and content marketing are both effective at lowering CACs in the software development industry. |
| Solar Energy | Solar companies benefit greatly from investing in local SEO campaigns, with consumer solar also seeing strong returns from organic and paid social. |
| Transportation & Logistics | Transportation and logistics companies can most effectively lower their CACs by investing in longer form content such as reports and white papers that can be repurposed for trade show materials. |
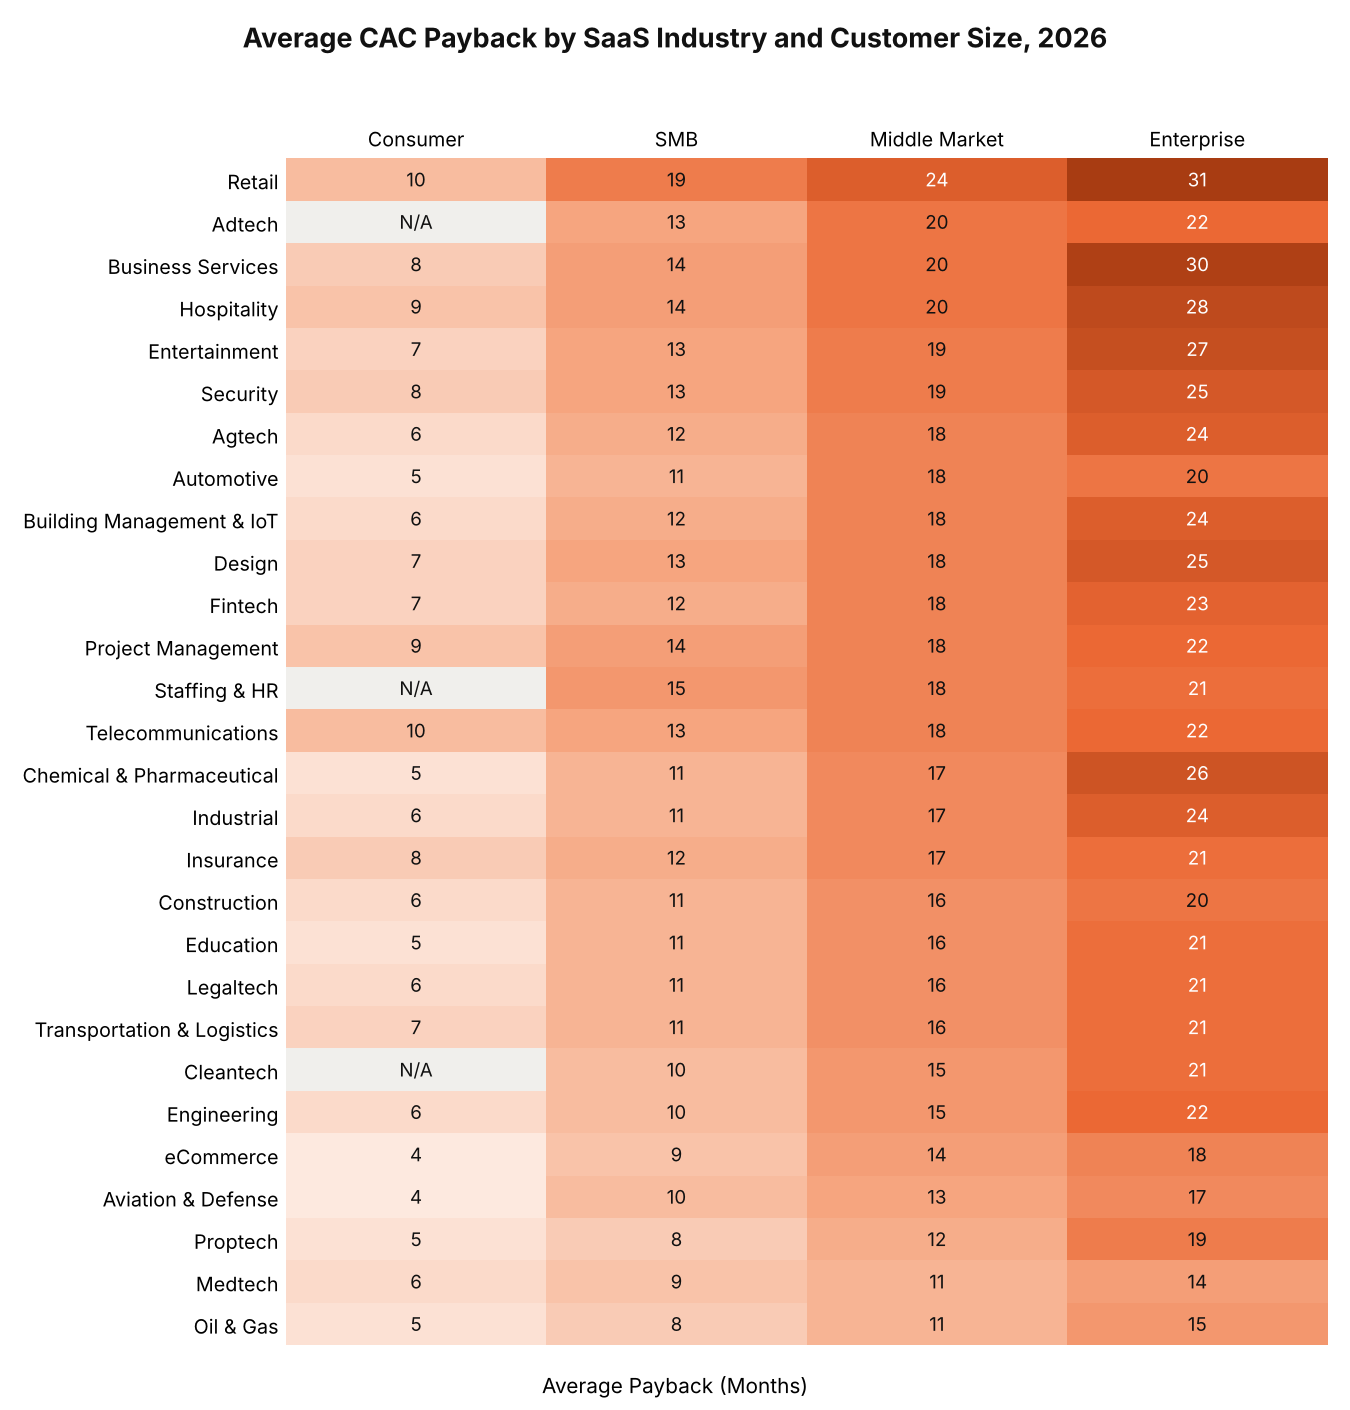
Average Customer Acquisition Cost (CAC) for SaaS Companies
In the table below, we break down average B2B CAC across 22 SaaS industries.
Average Customer Acquisition Cost (CAC) for SaaS Companies, 2026
| SaaS Industry | CAC |
| Agtech | $712 |
| Adtech | $560 |
| Building Management & IoT | $574 |
| Chemical & Pharmaceutical | $816 |
| Cleantech | $674 |
| Construction | $610 |
| Design | $658 |
| eCommerce | $274 |
| Education | $806 |
| Engineering | $551 |
| Fintech | $1,450 |
| Hospitality | $907 |
| Industrial | $542 |
| Insurance | $1,280 |
| Legaltech | $299 |
| Medtech | $921 |
| Project Management | $891 |
| Proptech | $518 |
| Security | $805 |
| Staffing & HR | $410 |
| Telecommunications | $694 |
| Transportation & Logistics | $483 |
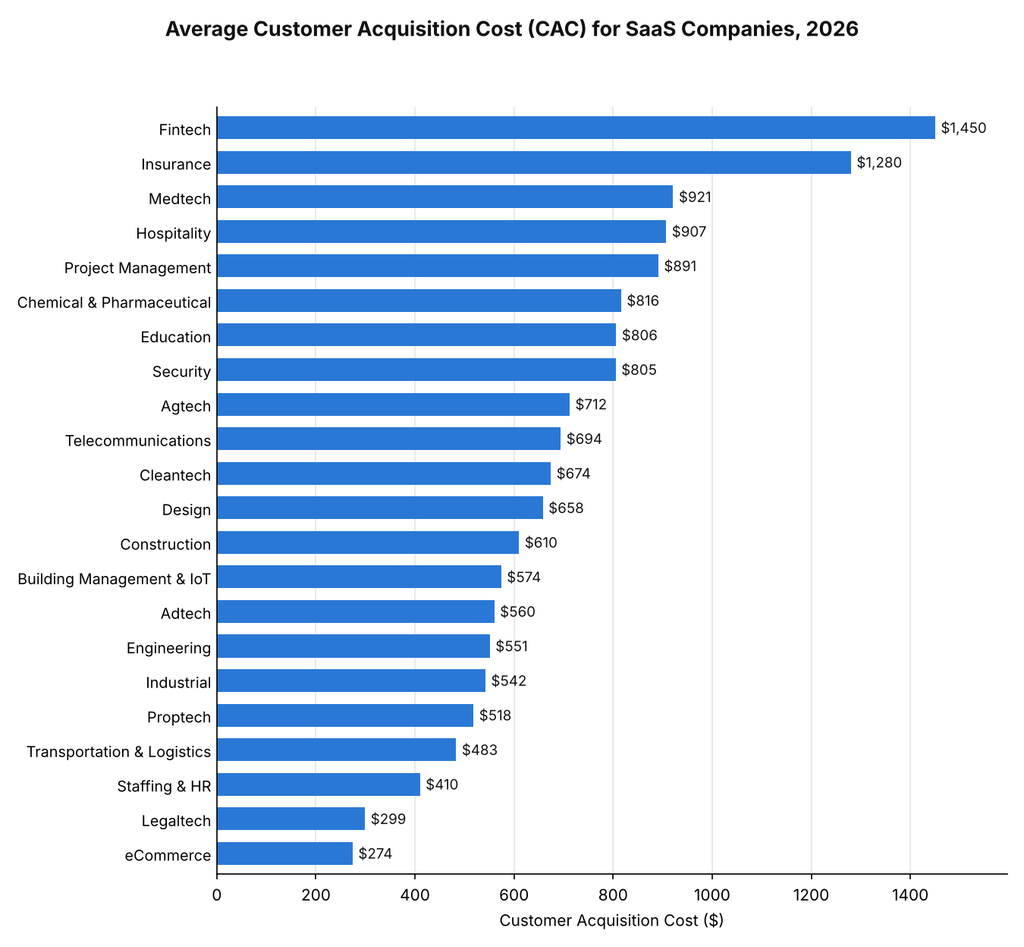
Three findings stood out to our team:
- We found Fintech at $1,450 and Insurance at $1,280 carrying the highest CACs of the 22 segments.
- Our data showed eCommerce at $274 and Legaltech at $299 as the only segments below $300.
- We found that the most expensive segment costs more than five times the least expensive, so a single SaaS average says little about any one market.
How CAC Relates to Customer Lifetime Value
CAC shows what a new customer costs, and customer lifetime value (LTV) shows the profit that customer returns. The simplest calculation divides monthly or annual profit by the number of unique customers in that period, then multiplies the result by the number of years the average customer continues to buy.
In the table below, we show how to read the LTV to CAC ratio. The standard target is at least 3 to 1.
LTV to CAC Ratio Benchmarks, 2026
| LTV to CAC Ratio | Interpretation |
| Below 1 to 1 | Each customer loses money |
| 1 to 1 to 2 to 1 | Marginal, indicating high churn or overspending on acquisition |
| 2 to 1 to 3 to 1 | Workable with a lean cost structure |
| 3 to 1 to 5 to 1 | Healthy, the standard target range |
| Above 5 to 1 | Strong, though it may signal underinvestment in growth |
Our researchers offer three points on using the ratio:
- We recommend weighing the ratio against historical trends. A 2 to 1 ratio with strong growth does not necessarily call for cutting marketing spend, because LTV rises as newer customers return.
- We found that new long-term campaigns lower the ratio at first. An SEO campaign takes about 4 to 6 months to show results, and the ratio should improve from there.
- We observed that organic channels take longer to pay off but do not require constant spend to maintain, which helps explain why Organic CAC leads in most industries. Results still depend on skill, so choosing the right firm matters.
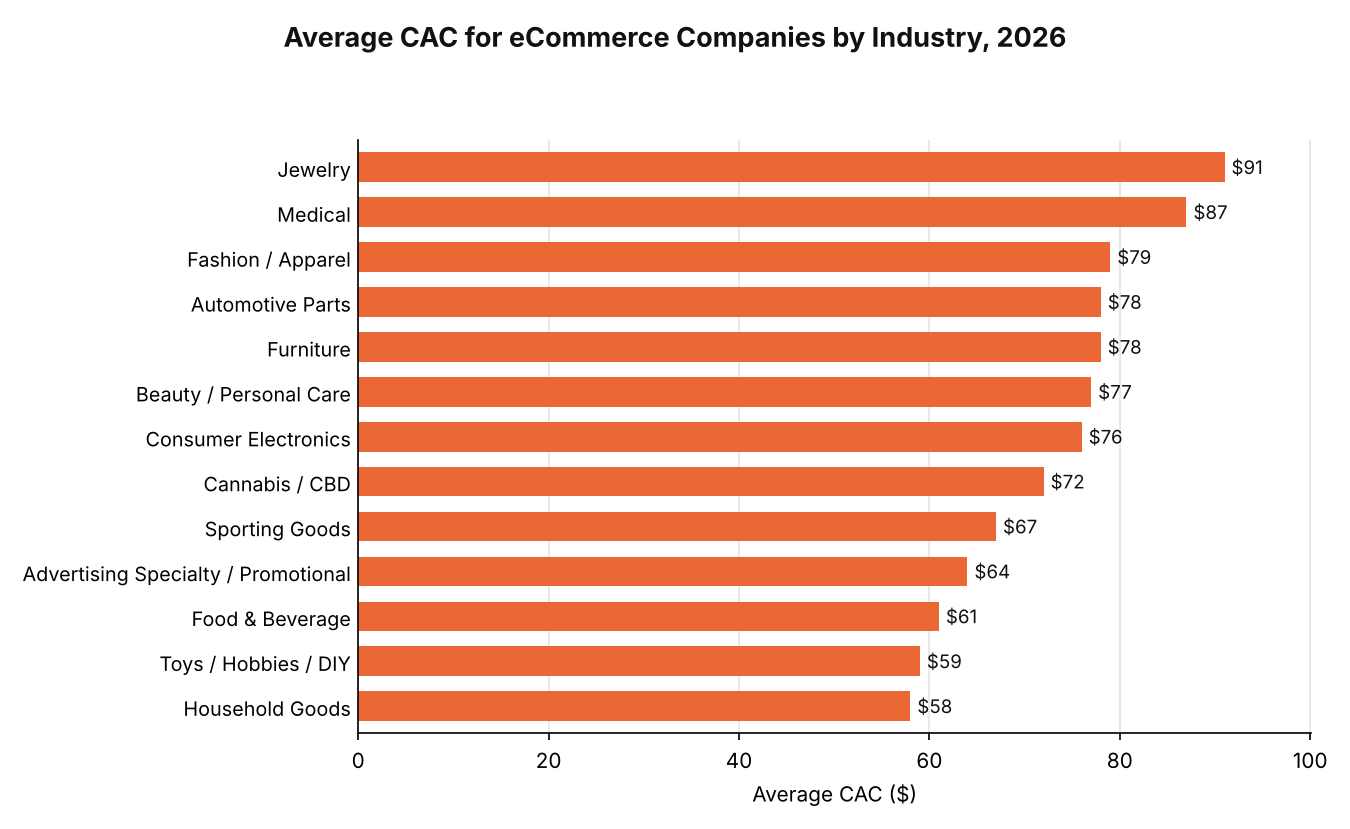
For more on this topic, see our reports on CAC by channel, average CAC for eCommerce companies, average CAC for SaaS businesses, and the SaaS LTV to CAC ratio.
Requesting a Copy of This Report
If you’d like to request a PDF copy of this report or learn more about our agency, you can reach out here.
- First Page Sage Research Study. First Page Sage. November 2026. San Francisco, California.
- Why Are Meta CPMs Rising? Sean Garschi, Growthr. October 2026.
- The 2026 SaaS Benchmarks Report. Ryan Allis, SaasRise. June 2026.
- Search Advertising Benchmarks. LocaliQ. 2026.
- Gross Revenue Retention (GRR) Benchmarks. Aleph and Benchmarkit. November 2026.